Overview
The observe decorator (Python) or function wrapper (JavaScript/TypeScript) is the simplest way to structure your traces in Laminar. It allows you to:
- Create a parent span that groups multiple LLM calls into a single trace
- Capture inputs and outputs of your functions automatically
- Structure your application’s tracing in a logical way
It handles span creation, activation, and ending automatically.
Basic Usage
JavaScript/TypeScript
Python
You can instrument specific functions by wrapping them in observe().
This is especially helpful when you want to trace functions, or group
separate functions into a single trace.import { observe } from '@lmnr-ai/lmnr';
const myFunction = async () => observe(
{ name: 'my_function'},
async () => {
const response = await client.chat.completions.create({
model: "gpt-5-nano",
messages: [{ role: "user", content: "What is the capital of France?" }],
});
return response.choices[0].message.content;
}
);
await myFunction();
You can instrument specific functions by adding the @observe() decorator.
This is especially helpful when you want to trace functions, or group
separate functions into a single trace.from lmnr import observe
@observe() # annotate all functions you want to trace
def my_function():
res = client.chat.completions.create(
model="gpt-5-nano",
messages=[{"role": "user", "content": "What is the capital of France?"}],
)
return res.choices[0].message.content
my_function()
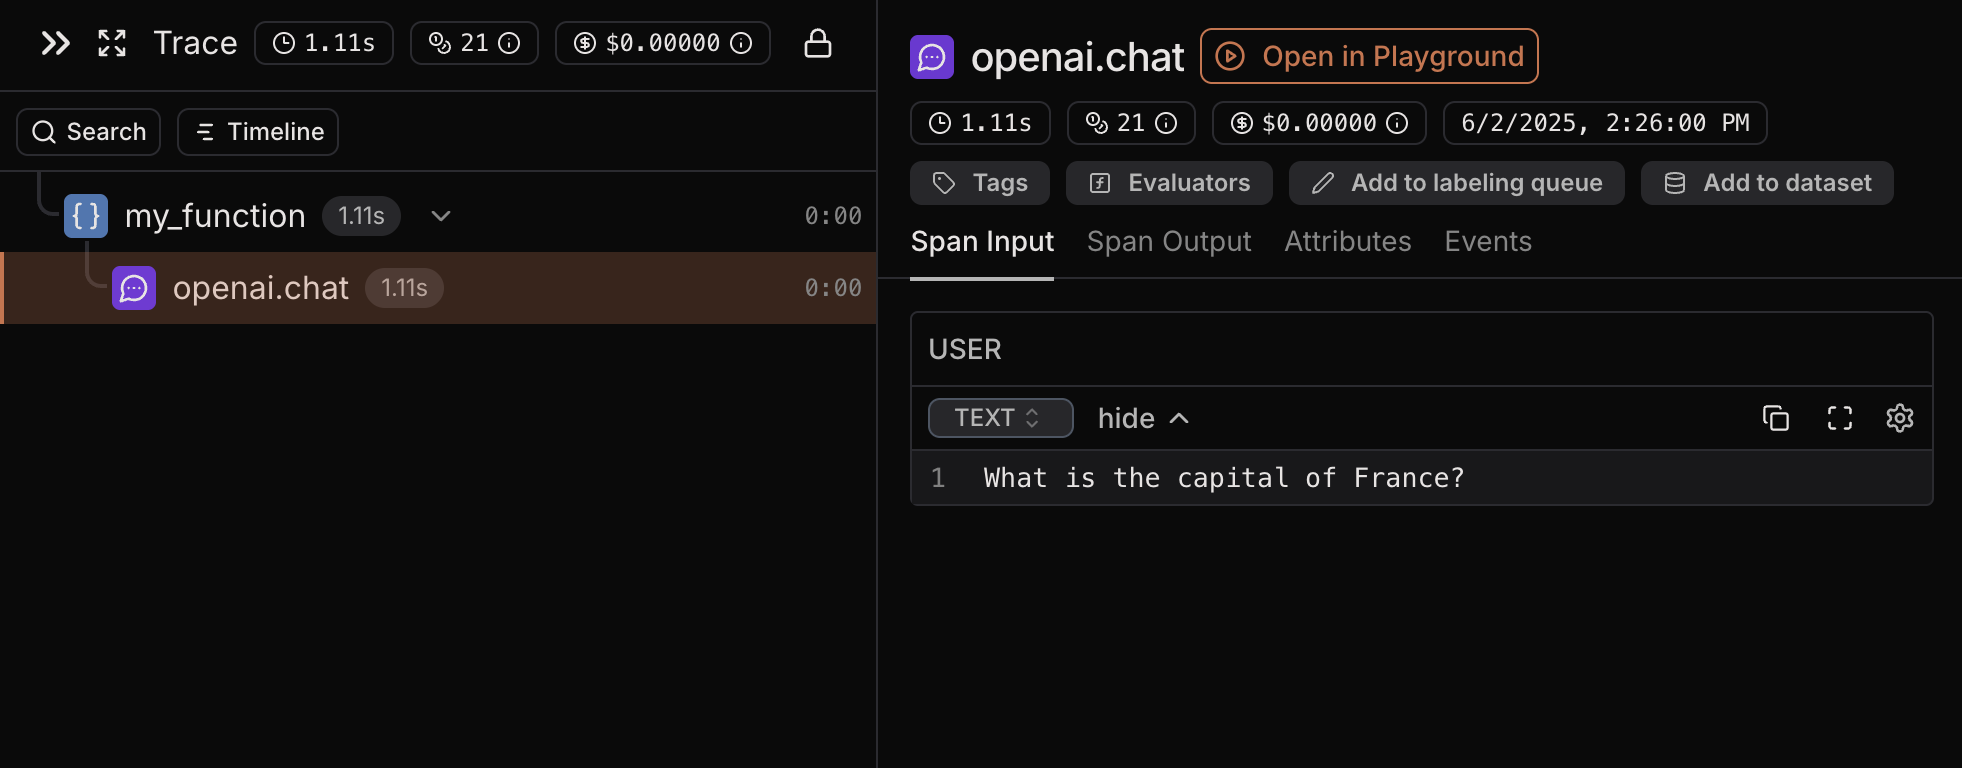
my_function and the OpenAI call, which is nested inside it, in the same trace. Notice that the OpenAI span is a child of my_function. Parent-child relationships are automatically detected and visualized with tree hierarchy.
You can nest as many spans as you want inside each other. By observing both the functions and the LLM/vector DB calls
you can have better visualization of execution flow which is useful for debugging and better understanding of the application.
observe call after the function. Example:
const myFunction = async () => observe(
  { name: 'sum' },
  async (param1, param2) => {
    return param1 + param2;
  },
  42,
  1337,
);
Detailed Reference
JavaScript/TypeScript
Python
General syntax
await observe({ ...options }, async (param1, param2) => {
  // your code here
}, arg1, arg2);
Parameters (ObserveOptions)
name (string): name of the span. If not passed, and the function to observe is not an anonymous arrow function, the function name will be used.sessionId (string): session ID for the wrapped trace.userId (string): user ID for the wrapped trace.metadata (Record<string, any>): metadata for the wrapped trace, must be json serializable.traceType ('DEFAULT'|'EVALUATION'): Type of the trace. Unless it is within evaluation, it must be 'DEFAULT'.spanType ('DEFAULT'|'LLM') - Type of the span. 'DEFAULT' is used if not specified. If the type is 'LLM',
you must manually specify some attributes. This translates to lmnr.span.type attribute on the span.input: a dictionary of input parameters. Is preferred over function parameters.ignoreInput (boolean): if true, the input will not be recorded.ignoreOutput (boolean): if true, the output will not be recorded.tags (string[]): array of tags to add to the span.
- Function parameters and their values are serialized to JSON and recorded as span input.
- Function return value is serialized to JSON and recorded as span output.
For example:const result = await observe({ name: 'my_span' }, async (param1, param2) => {
return param1 + param2;
}, 1, 2);
- Span input (
lmnr.span.input) will be [1, 2]
- Span output (
lmnr.span.output) will be 3
Parameters
name (str|None): name of the span. If not provided, the name of the wrapped function will be used.
For example:
@observe(name="my_span")
def my_function(): # the span will be named "my_span"
    pass

@observe()
def my_function(): # the span will be named "my_function"
    pass
session_id (str|None): session ID for the current trace. If you know the session ID statically, you can pass it here.user_id (str|None): user ID for the current trace. If you know the user ID statically, you can pass it here.metadata (dict[str, Any]): metadata for the current trace. Must be json serializable.tags (list[str]): list of tags to add to the span.ignore_input (bool): if True, the input will not be recorded.ignore_output (bool): if True, the output will not be recorded.ignore_inputs (list[str]): list of input parameters to skip.input_formatter (Callable[P, str])*: a function to format the input parameters. Must take same parameters as the observed function and return a string.output_formatter (Callable[[R], str])*: a function to format the output value. Must take the return value of the observed function and return a string.
* P and R indicate that the observed function is of type Callable[P, R] or Callable[P, Awaitable[R]].
- Function parameters and their values are serialized to JSON and recorded as span input.
- Function return value is serialized to JSON and recorded as span output.
For example:@observe()
def my_function(param1, param2):
return param1 + param2
my_function(1, 2)
- Span input (
lmnr.span.input) will be {"param1": 1, "param2": 2}
- Span output (
lmnr.span.output) will be 3
Use Cases
Grouping LLM Calls
One of the most common use cases for observe is to group multiple LLM calls into a single trace:
JavaScript/TypeScript
Python
import { Laminar, observe } from '@lmnr-ai/lmnr';
import { OpenAI } from 'openai';

const handle = async (userMessage) =>
    await observe({name: 'requestHandler'}, async () => {
        // First LLM call
        const routerResponse = await openai.chat.completions.create({
            messages: [
                {role: 'user', content: 'First prompt' + userMessage}
            ],
            model: 'gpt-4o-mini',
        });

        // Second LLM call
        const modelResponse = await openai.chat.completions.create({
            messages: [
                {role: 'user', content: userMessage}
            ],
            model: 'gpt-4o',
        });

        return modelResponse.choices[0].message.content;
    });
from lmnr import Laminar, observe
from openai import OpenAI

@observe()
def request_handler(user_message: str):
    # First LLM call
    router_response = openai_client.chat.completions.create(
        model="gpt-4o-mini",
        messages=[
            {
                "role": "user",
                "content": "First prompt" + user_message
            }
        ]
    )

    # Second LLM call
    model_response = openai_client.chat.completions.create(
        model="gpt-4o",
        messages=[
            {
                "role": "user",
                "content": user_message
            }
        ]
    )
    return model_response.choices[0].message.content
Alternative Methods
In Python, you can also use Laminar.start_as_current_span if you want to trace a specific block of code:
from lmnr import Laminar

def request_handler(user_message: str):
    with Laminar.start_as_current_span(
        name="handler",
        input=user_message
    ) as span:
        # Your code here

        # Set output of the current span
        Laminar.set_span_output(result)
        return result