What is Laminar Tracing?
Laminar offers comprehensive observability for your LLM applications, capturing the entire execution flow with minimal setup. This allows you to: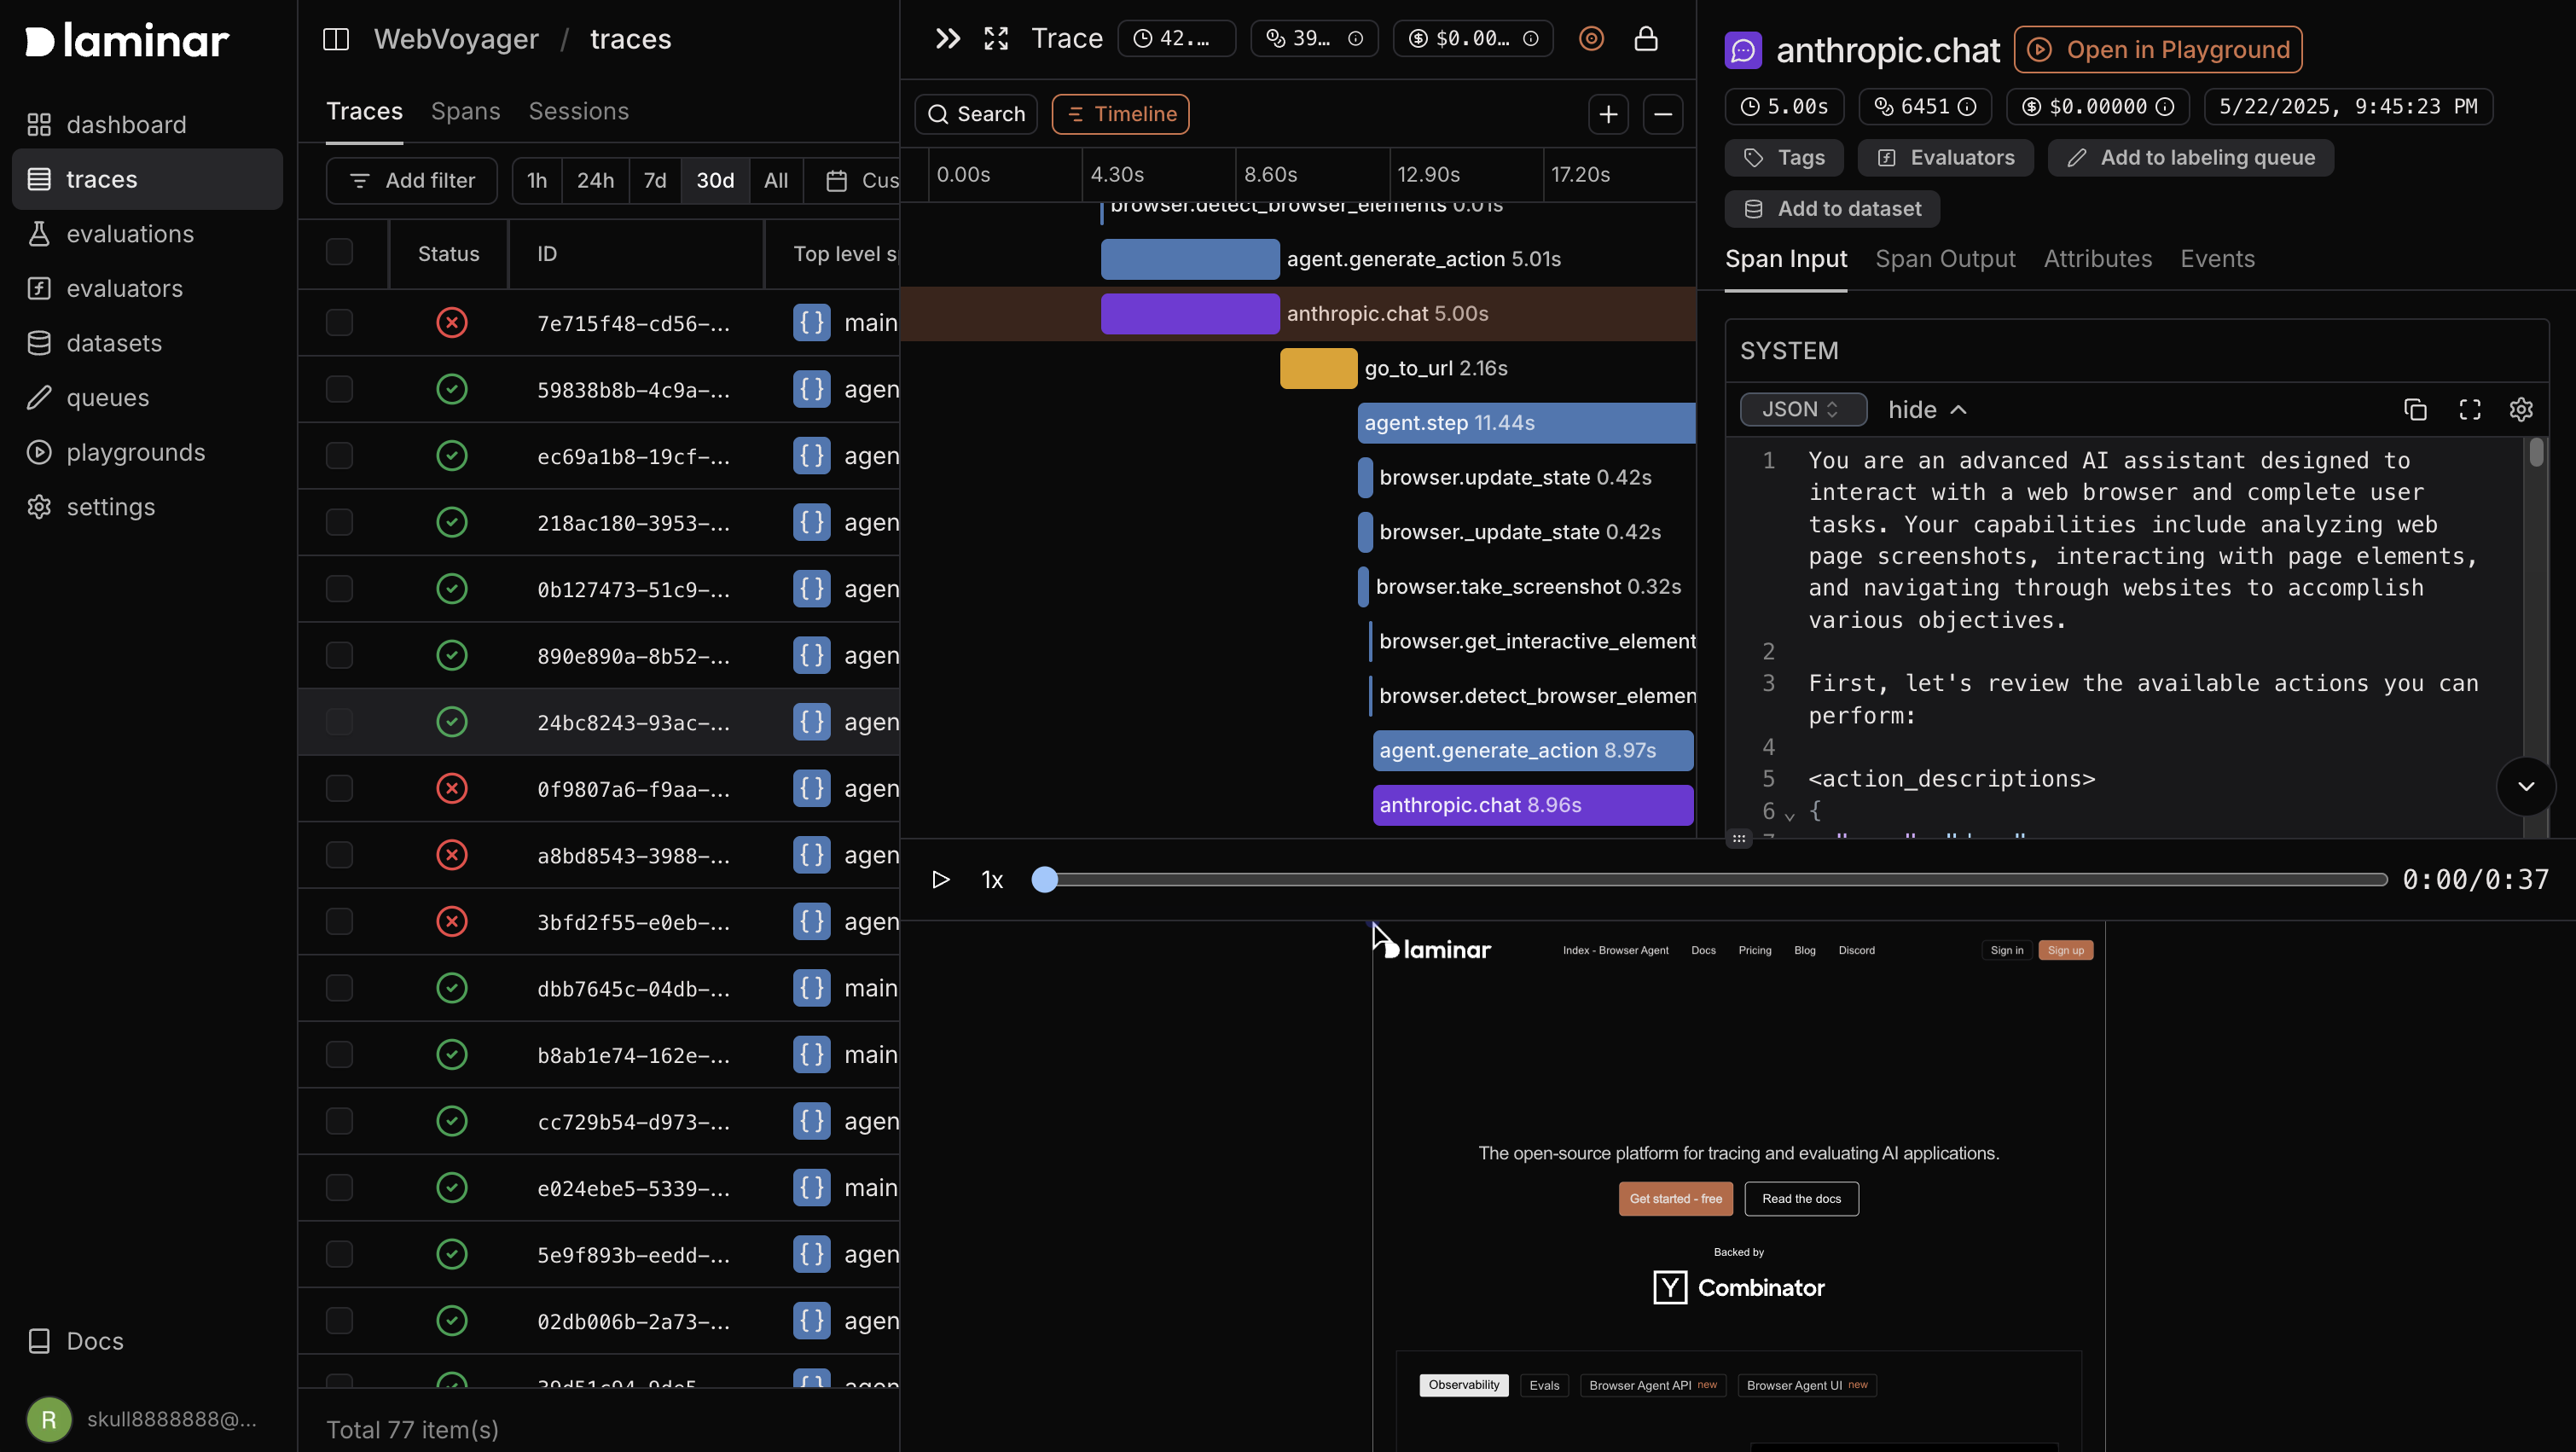
- Debug complex Agents and LLM workflows by seeing exactly how data flows through your application
- Monitor performance with detailed execution time and token usage metrics
- Track costs across different models and components
- Analyze user sessions to understand and improve the end-user experience
Key Concepts
Example of a trace view on the Laminar platform: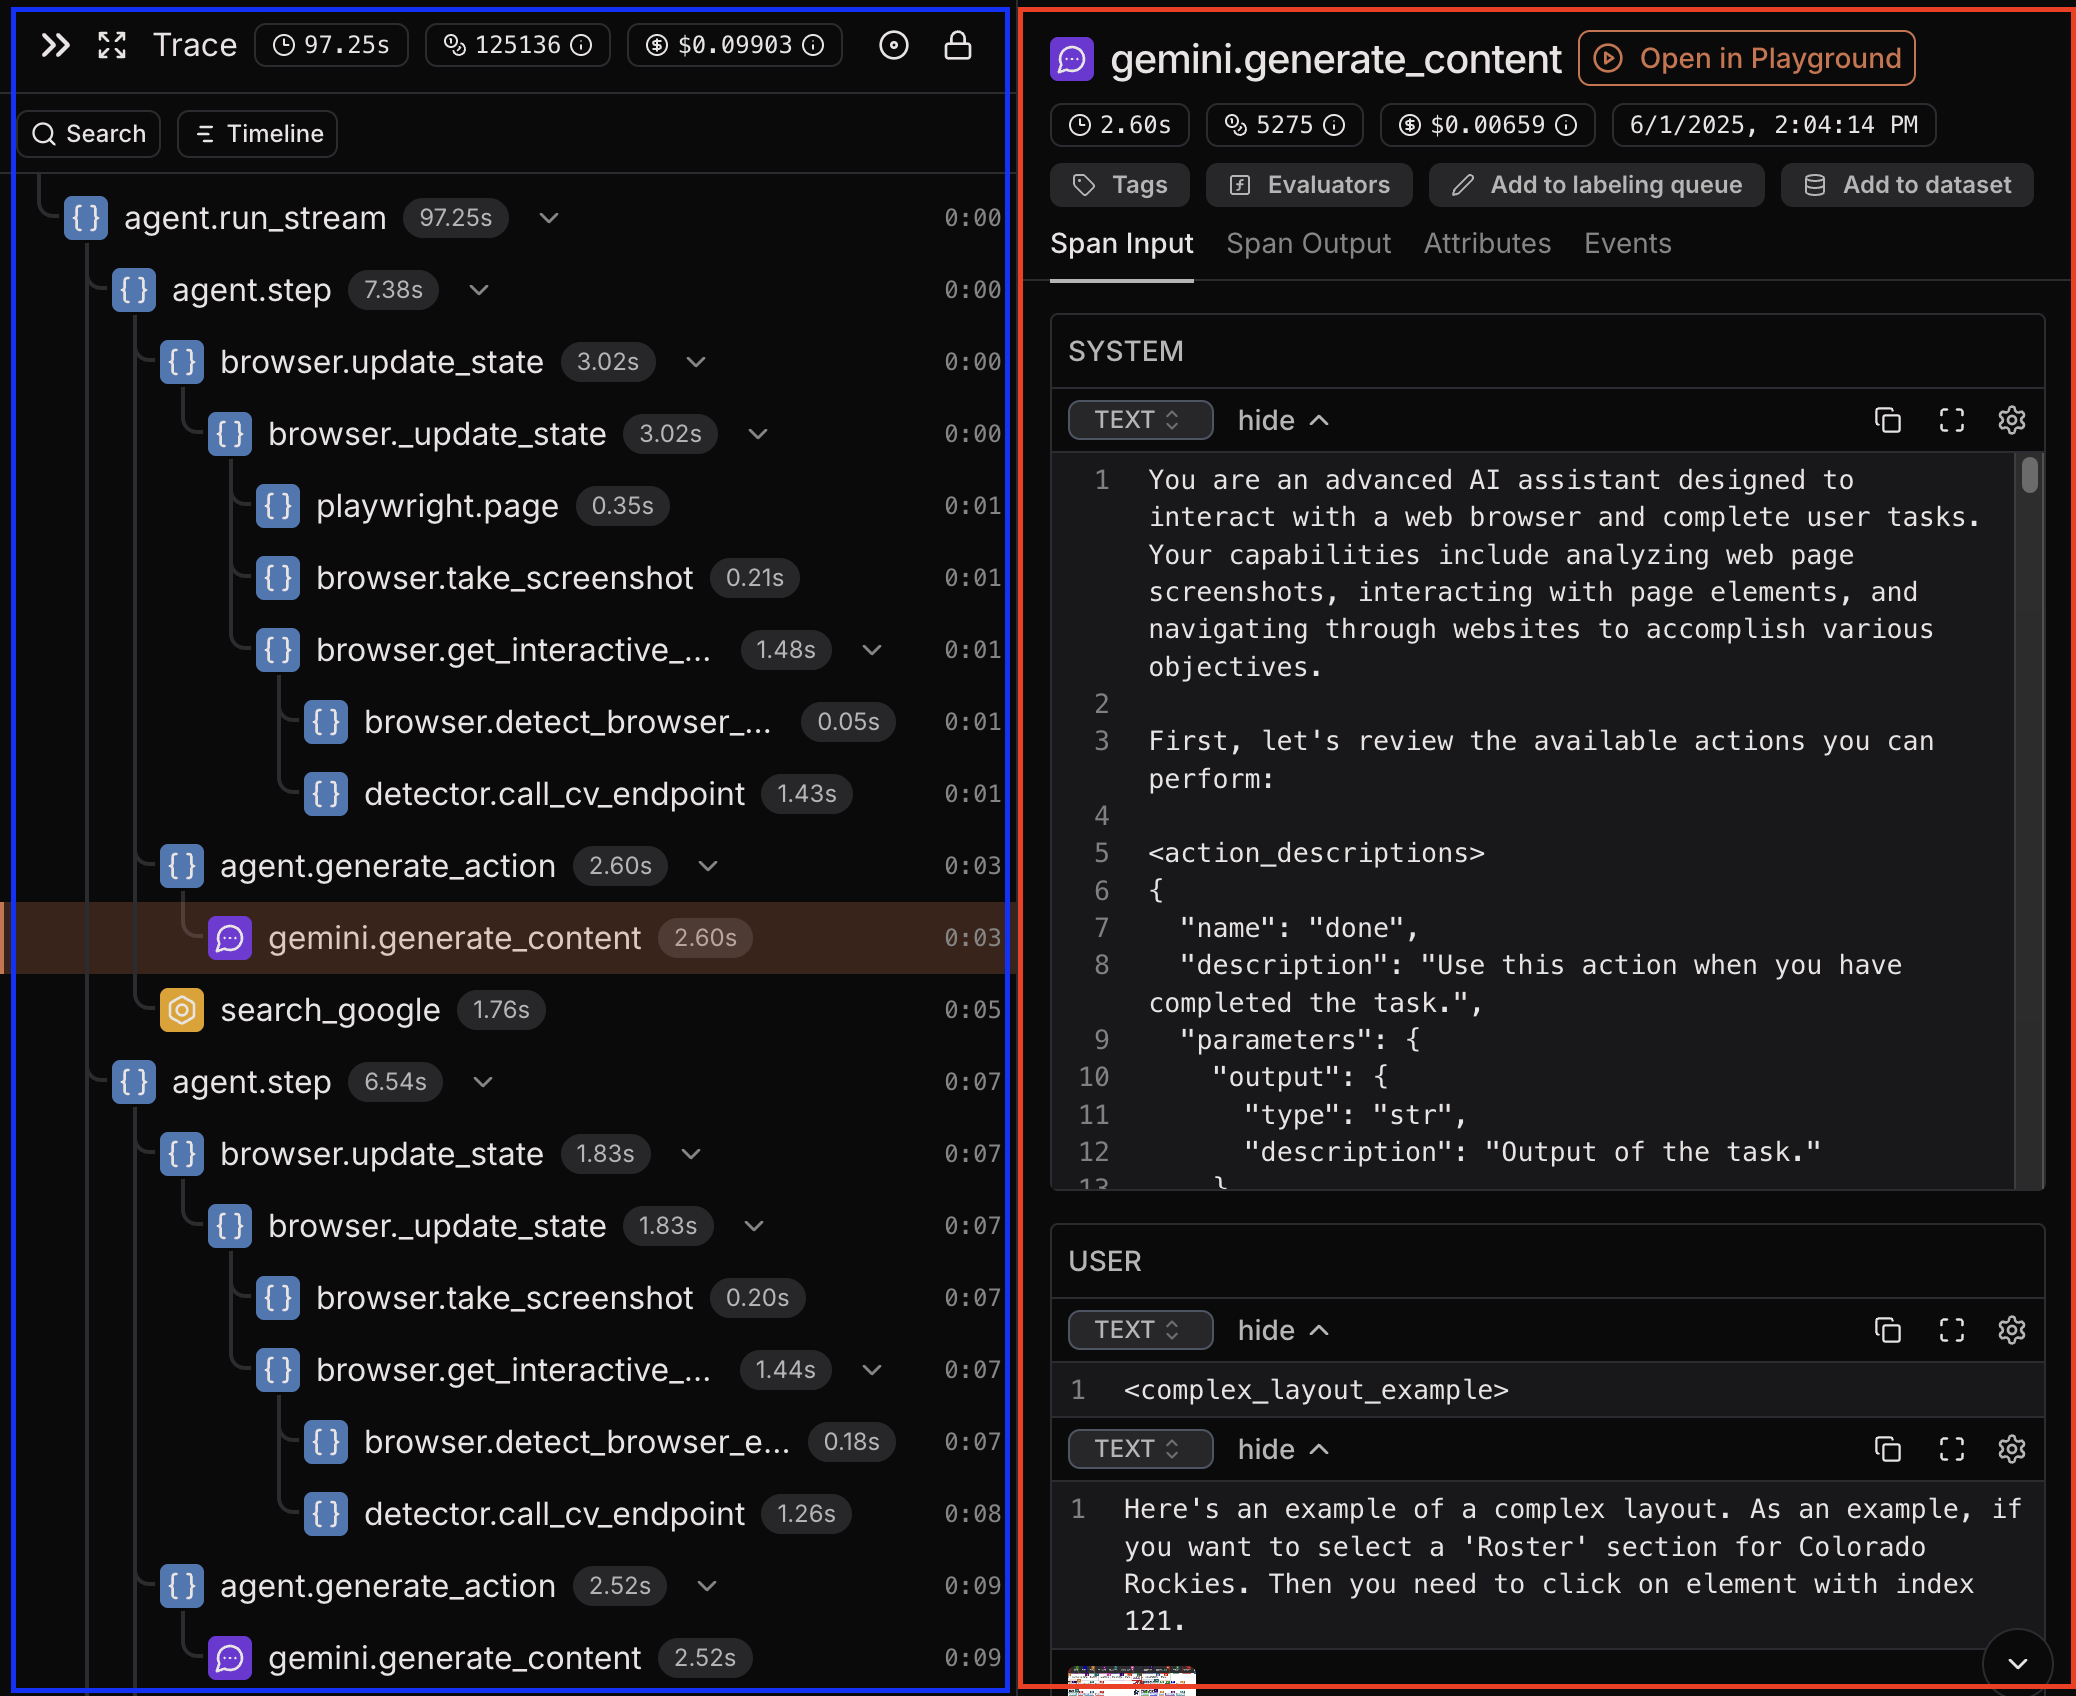
Span
A single operation in your application’s execution flow, such as LLM call, function call, or API request. In the screenshot above, the spans are the nodes in the tree view. Selected spangemini.generate_content is highlighted in red and represents the LLM call to Gemini model.
Each span has:
- Name: The name of the span (e.g.,
gemini.generate_content) - Input: The input of the function representing a span. In case of an LLM call, this is the prompt.
- Output: The output of the function representing a span. In case of an LLM call, this is the response from the model.
- Duration: How long the operation took to execute
- Path: Hierarchical path of the span in the trace (e.g.,
get_user.validate.api_call). - Attributes: Input parameters, return values, and other metadata
Trace
Trace is a collection of spans that form a complete execution path. In the screenshot above, spans of the trace are highlighted in blue. Traces spans within a trace show parent-child relationships between operations, helping you understand how your code executes.Session
Laminar helps you group related traces belonging to the same user interaction or conversation under a session. It can be used to group traces of a multi-turn conversation, or complex workflows.What Laminar Captures
For every execution of your application, Laminar automatically records:Performance Metrics
- Total execution time
- Per-span execution times
- Bottlenecks and slow operations
LLM-Specific Data
- Token counts (input and output)
- Model information
- Cost calculations
Inputs & Outputs
- Function parameters
- Return values
- Prompts and completions
Execution Flow
- Parent-child relationships
- Complete call hierarchy
- Cross-service transactions
Next Steps
Now that you understand the basics of Laminar tracing:- Get started quickly with our Quickstart Guide
- Explore our integrations to see how Laminar works with your favorite tools:
- Continue to Trace Structure to learn more about how to add structure to your traces
- Explore Browser agent observability to learn how to record browser sessions and sync them with agent execution steps