1. Get Your Project API Key
To get your Project API Key, navigate to your project settings page on the Laminar dashboard and create new project API key.
Next, you’ll need to set this key as an environment variable in your project. Create a .env file in the root of your project (if you don’t have one already) and add the following line:
LMNR_PROJECT_API_KEY=your_project_api_key_here
your_project_api_key_here with the actual key you copied.
2. Initialize Laminar in Your Application
Adding just two lines to your application enables comprehensive tracing:
JavaScript/TypeScript
Python
import { Laminar } from '@lmnr-ai/lmnr';
import { OpenAI } from 'openai';
Laminar.initialize({
    projectApiKey: process.env.LMNR_PROJECT_API_KEY,
    instrumentModules: {
        openAI: OpenAI,
        // add other libraries as you need
    }
});
from lmnr import Laminar
Laminar.initialize(project_api_key="LMNR_PROJECT_API_KEY")
Laminar should be initialized once in your application. This could be
at the server startup, or in the entry point of your application.
For Node JS setups, you need to manually pass the modules you want to instrument, such as OpenAI.
See the section on automatic instrumentation. 3. That’s it! Your LLM API Calls Are Now Traced
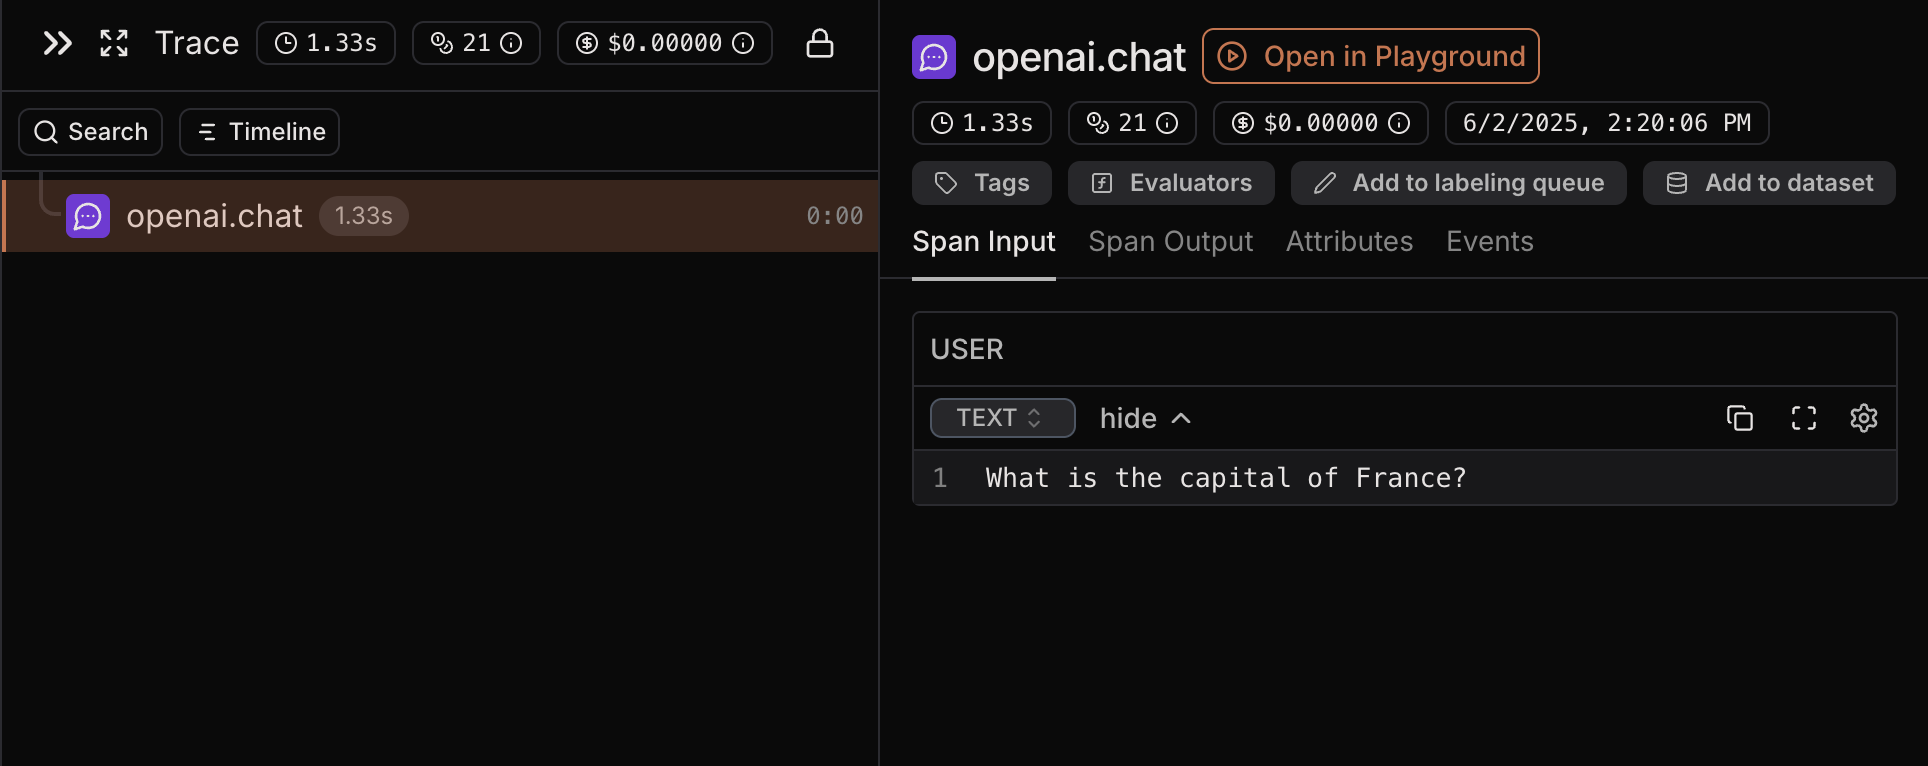
Once initialized, Laminar automatically traces LLM API calls. For example, after initialization, this standard OpenAI call:
JavaScript/TypeScript
Python
// Laminar was initialized before this code

import { OpenAI } from 'openai';

const client = new OpenAI({ apiKey: process.env.OPENAI_API_KEY });
const response = await client.chat.completions.create({
    model: "gpt-4o-mini",
    messages: [{ role: "user", content: "What is the capital of France?" }],
});
# Laminar was initialized before this code

from openai import OpenAI

client = OpenAI(api_key=os.environ["OPENAI_API_KEY"])
response = client.chat.completions.create(
    model="gpt-4o-mini",
    messages=[{"role": "user", "content": "What is the capital of France?"}],
)
Laminar automatically captures important LLM metrics including latency, token usage, and cost calculations based on the specific model used.
Tracing Custom Functions
Beyond automatic LLM tracing, you can use the observe decorator/wrapper to trace specific functions in your application:
JavaScript/TypeScript
Python
You can instrument specific functions by wrapping them in observe().
This is especially helpful when you want to trace functions, or group
separate functions into a single trace.import { observe } from '@lmnr-ai/lmnr';
const myFunction = async () => observe(
{ name: 'my_function'},
async () => {
const response = await client.chat.completions.create({
model: "gpt-5-nano",
messages: [{ role: "user", content: "What is the capital of France?" }],
});
return response.choices[0].message.content;
}
);
await myFunction();
You can instrument specific functions by adding the @observe() decorator.
This is especially helpful when you want to trace functions, or group
separate functions into a single trace.from lmnr import observe
@observe() # annotate all functions you want to trace
def my_function():
res = client.chat.completions.create(
model="gpt-5-nano",
messages=[{"role": "user", "content": "What is the capital of France?"}],
)
return res.choices[0].message.content
my_function()
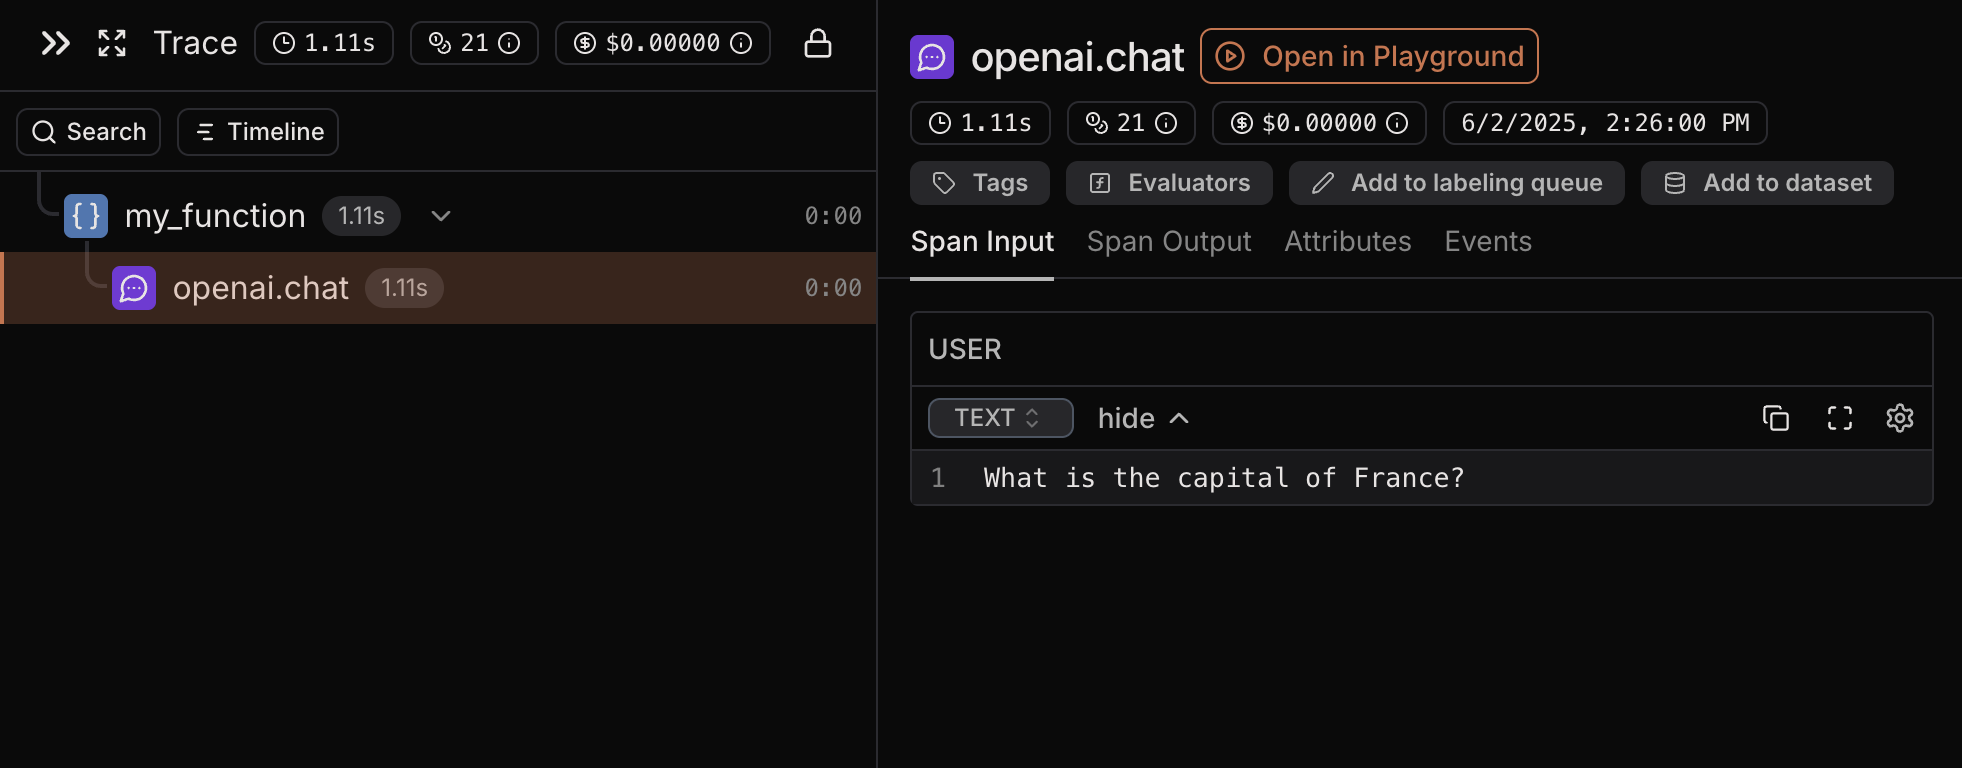
my_function and the OpenAI call, which is nested inside it, in the same trace. Notice that the OpenAI span is a child of my_function. Parent-child relationships are automatically detected and visualized with tree hierarchy.
You can nest as many spans as you want inside each other. By observing both the functions and the LLM/vector DB calls
you can have better visualization of execution flow which is useful for debugging and better understanding of the application.
observe call after the function. Example:
const myFunction = async () => observe(
  { name: 'sum' },
  async (param1, param2) => {
    return param1 + param2;
  },
  42,
  1337,
);
Next Steps
- Explore our integrations to see how Laminar works with your favorite tools:
- Continue to Trace Structure to learn more about adding structure to your traces.
- Explore Browser agent observability to trace browser sessions and agent execution steps.
- If you want to get into details on OpenTelemetry, check out the in-depth OpenTelemetry guide.