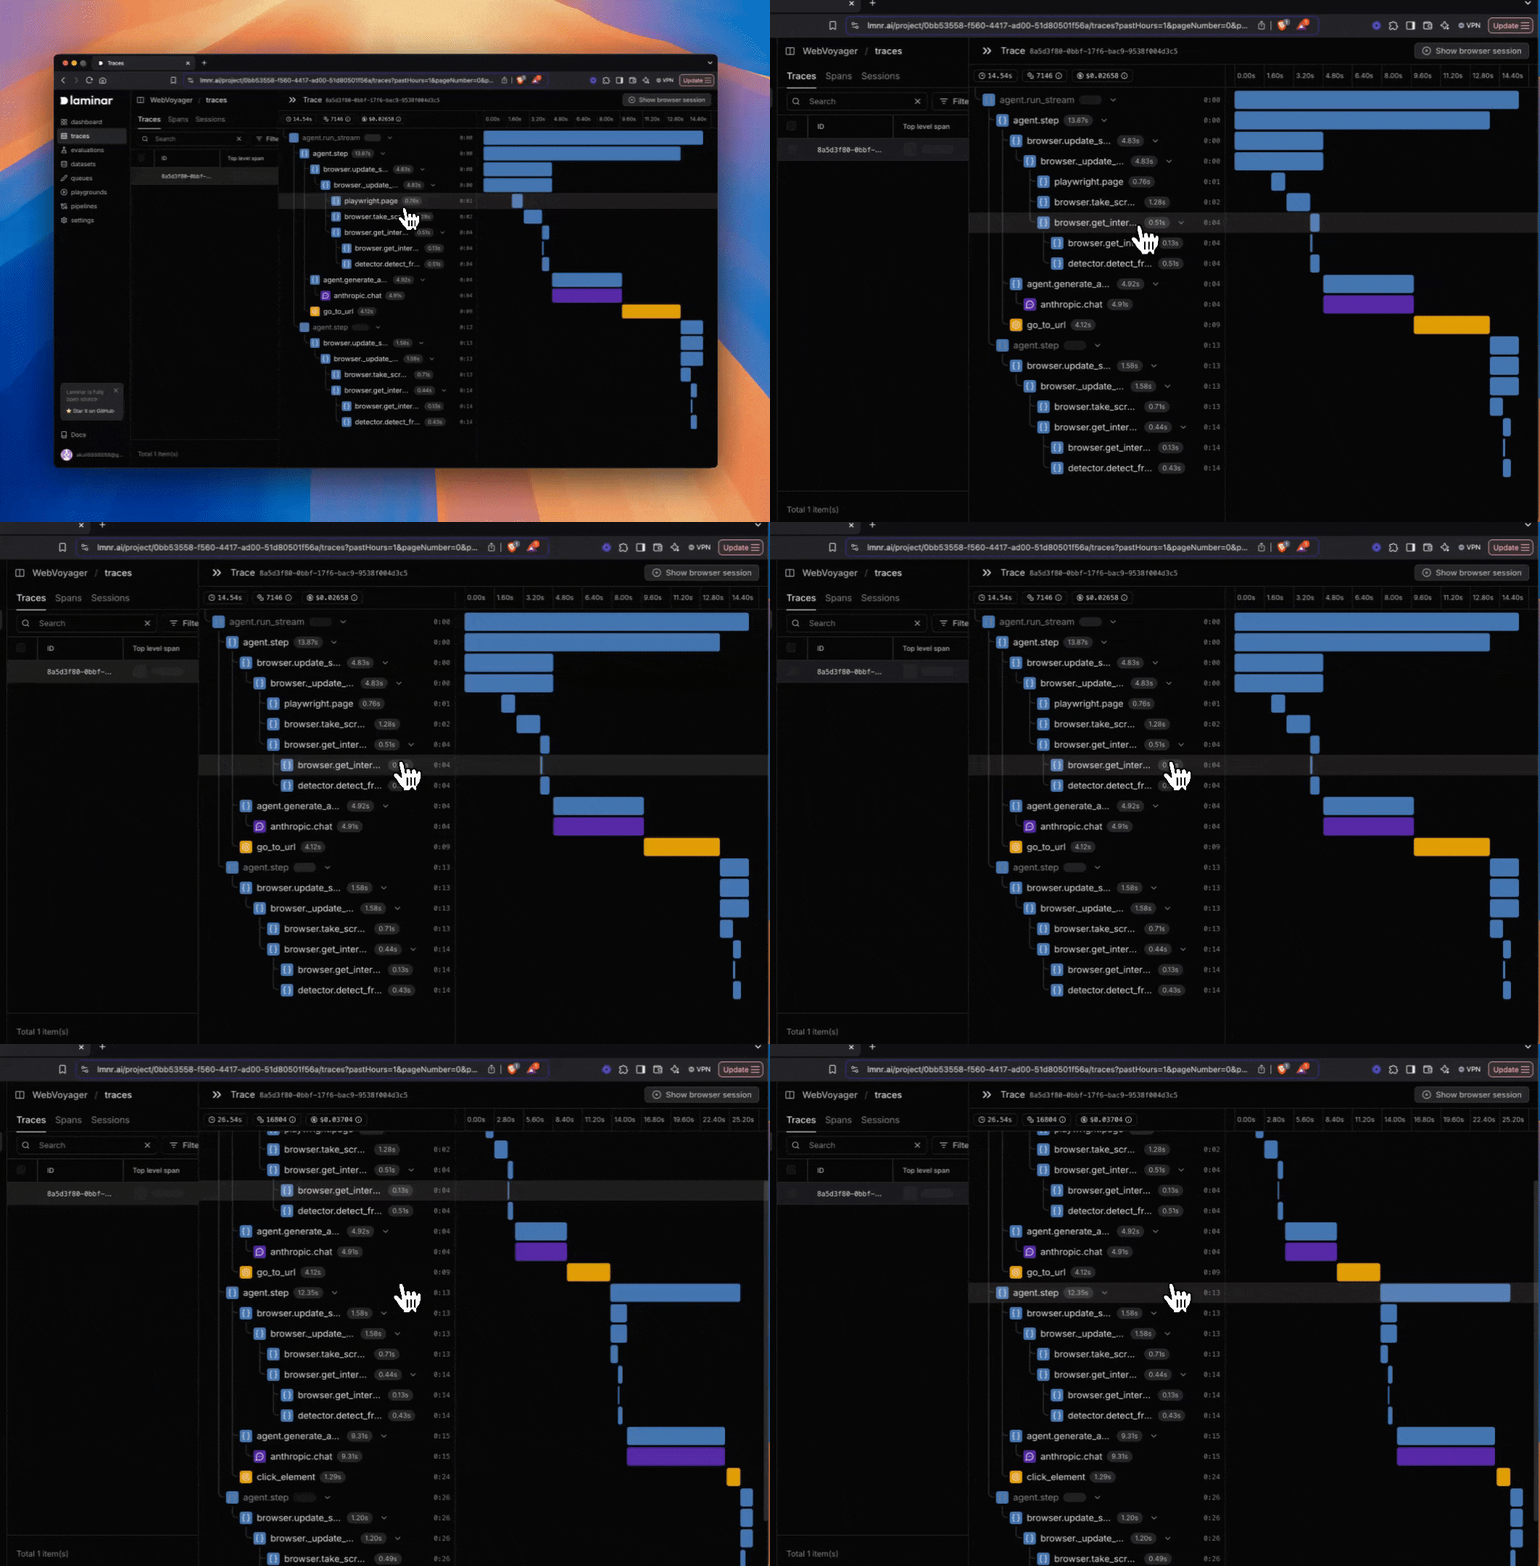
Overview
Real-time traces are one of Laminar’s most powerful features, allowing you to see spans as they’re being executed without waiting for the top-level span to complete. This provides immediate visibility into trace data during development and debugging processes, which is especially valuable when:- Working with long-running operations
- Debugging complex agent interactions
- Monitoring multiple chained LLM requests
- Testing a system in development

How It Works
Laminar uses OpenTelemetry for trace collection and processing. By default, it usesBatchSpanProcessor, which buffers and sends traces in batches to optimize performance:
- Traces are collected and stored temporarily on the client side
- Data is sent periodically to the Laminar backend
- There’s a small delay between span completion and dashboard visibility
- The delay depends on batch configuration (flush interval and batch size)
Real-time traces are currently available only in the Laminar cloud platform.
Disable Batching (Optional)
For immediate trace visibility, you can disable batching by settingdisableBatch to true in the Laminar.initialize function:
- JavaScript/Typescript
- Python
SimpleSpanProcessor, which processes and sends traces immediately.
Performance Considerations
- Development: Real-time processing provides immediate feedback, beneficial for debugging and development workflows
- Production: Batch processing is recommended for better performance and resource utilization
While real-time traces provide immediate visibility, disabling batching may impact application performance in production environments.
Benefits
- Immediate Feedback: See traces as they happen, without waiting for operations to complete
- Faster Debugging: Identify issues in real-time without waiting for batched processing
- Progress Monitoring: Track long-running operations as they execute
- Enhanced Development Experience: Test and iterate more quickly with instant visibility
