Overview
In this guide, we’ll follow the complete journey of building and improving a Data Analysis Assistant - an AI agent that helps users analyze their data, create visualizations, and generate insights. This example showcases how Laminar’s end-to-end platform helps you build reliable tool-calling agents.
Why This Guide Matters
Tool-calling agents are powerful but complex - they need to select the right tools, use correct parameters, and handle multi-step workflows. Unlike simple text generation, evaluating these agents requires understanding their decision-making process and systematic improvement based on real user interactions.
What You’ll Learn
Step 1: Tracing agent in production
Capture real user interactions automatically to understand how the agent behaves in production.
Step 2: Collecting user feedback
Collect user feedback via tagging with Laminar SDK to understand when the agent helps vs. frustrates users.
Step 3: Identifying failure patterns with SQL query editor
Identify systematic issues by querying the traced interactions to find failure patterns.
Step 4: Label data and create evaluation dataset
Label the problematic cases and create an evaluation dataset using Laminar’s labeling queue interface.
Step 5: Running evaluations
Experiment with the agent prompt to see whether the agent is improving with the new prompt.
This end-to-end approach ensures our Data Analysis Assistant continuously improves based on real user interactions rather than hypothetical test cases.
The Data Analysis Assistant
Our assistant helps users analyze data through natural language queries like:
- “How did our revenue perform last quarter?”
- “Show me user engagement trends over time”
- “Find any anomalies in our conversion rates”
tools = [
{
"type": "function",
"function": {
"name": "query_database",
"description": "Execute SQL queries to retrieve data from the database",
"parameters": {
"type": "object",
"properties": {
"query": {"type": "string", "description": "SQL query to execute"},
"database": {"type": "string", "enum": ["analytics", "sales", "users"]}
},
"required": ["query", "database"]
}
}
},
{
"type": "function",
"function": {
"name": "create_visualization",
"description": "Create charts and graphs from data",
"parameters": {
"type": "object",
"properties": {
"data": {"type": "string", "description": "Data to visualize"},
"chart_type": {"type": "string", "enum": ["line", "bar", "pie", "scatter"]},
"title": {"type": "string", "description": "Chart title"}
},
"required": ["data", "chart_type"]
}
}
},
{
"type": "function",
"function": {
"name": "generate_summary",
"description": "Generate insights and summary from analysis",
"parameters": {
"type": "object",
"properties": {
"data": {"type": "string", "description": "Data to summarize"},
"focus": {"type": "string", "description": "What to focus the summary on"}
},
"required": ["data"]
}
}
},
{
"type": "function",
"function": {
"name": "compare_periods",
"description": "Compare metrics across different time periods",
"parameters": {
"type": "object",
"properties": {
"metric": {"type": "string", "description": "Metric to compare"},
"period1": {"type": "string", "description": "First time period"},
"period2": {"type": "string", "description": "Second time period"}
},
"required": ["metric", "period1", "period2"]
}
}
},
{
"type": "function",
"function": {
"name": "detect_anomalies",
"description": "Identify unusual patterns or outliers in data",
"parameters": {
"type": "object",
"properties": {
"data": {"type": "string", "description": "Data to analyze for anomalies"},
"sensitivity": {"type": "string", "enum": ["low", "medium", "high"]}
},
"required": ["data"]
}
}
}
]
Step 1: Production Tracing with Laminar
First, let’s set up automatic tracing for our Data Analysis Assistant in production:
import os
import json
from openai import OpenAI
from lmnr import Laminar, observe
from dotenv import load_dotenv
load_dotenv()
# Initialize Laminar for automatic tracing
Laminar.initialize()
client = OpenAI()
@observe(name="analyze_data")
def analyze_data(messages: list):
"""Main agent function that accepts input messages and handles tool calls"""
# Hardcode system message at the beginning
full_messages = [
{
"role": "system",
"content": """You are a data analysis assistant. Use the available tools to help users analyze their data and generate insights. Always:
1. Query the appropriate database first
2. Create visualizations when helpful
3. Provide clear summaries of findings
4. Compare time periods when relevant
IMPORTANT: Always start by understanding what data you need, then query it, then process it."""
}
]
# Add input messages (skip any existing system messages)
for msg in messages:
if msg["role"] != "system":
full_messages.append(msg)
# Loop to handle multiple rounds of tool calls
max_iterations = 5 # Prevent infinite loops
iteration = 0
while iteration < max_iterations:
iteration += 1
# Make LLM call
response = client.chat.completions.create(
model="o4-mini",
messages=full_messages,
tools=tools,
tool_choice="auto"
)
# Add assistant's response to messages
assistant_message = {
"role": "assistant",
"content": response.choices[0].message.content
}
if response.choices[0].message.tool_calls:
assistant_message["tool_calls"] = response.choices[0].message.tool_calls
full_messages.append(assistant_message)
# If no tool calls, we have our final response
if not response.choices[0].message.tool_calls:
return response.choices[0].message.content
# Execute tool calls
for tool_call in response.choices[0].message.tool_calls:
tool_name = tool_call.function.name
tool_args = json.loads(tool_call.function.arguments)
# Simulate tool execution (replace with actual implementations)
result = simulate_tool_execution(tool_name, tool_args)
# Add tool result to messages
full_messages.append({
"role": "tool",
"tool_call_id": tool_call.id,
"name": tool_name,
"content": result
})
# If we've hit max iterations, return what we have
return response.choices[0].message.content or "Analysis completed with multiple tool calls."
def simulate_tool_execution(tool_name, args):
# this will mark this span as a tool span
with Laminar.start_as_current_span(name=tool_name, span_type="TOOL"):
"""Simulate tool execution - replace with real implementations"""
if tool_name == "query_database":
return "Sample data: Revenue Q4 2024: $1.2M, Q3 2024: $1.0M"
elif tool_name == "create_visualization":
return "Chart created successfully"
elif tool_name == "generate_summary":
return "Key insight: 20% revenue growth quarter-over-quarter"
elif tool_name == "compare_periods":
return "Q4 vs Q3: +20% increase in revenue"
elif tool_name == "detect_anomalies":
return "No significant anomalies detected"
return "Tool executed successfully"
# Example usage in production
if __name__ == "__main__":
messages = [
{
"role": "user",
"content": "How did our revenue perform last quarter compared to the previous quarter?"
}
]
result = analyze_data(messages)
print(result)
How Laminar Tracing Works
This agent demonstrates several key tracing concepts:
- Top-Level Span: The
@observe(name="analyze_data")
decorator creates a top-level span that captures the entire agent execution
- Automatic LLM Tracing: Laminar automatically traces the LLM call made via OpenAI API (and other supported popular LLM frameworks and SDKs, such as Langchain, Anthropic, etc.)
- Manual Tool Spans: Each tool execution is wrapped in
Laminar.start_as_current_span(name=tool_name, span_type="TOOL")
to create dedicated tool spans
With this setup, every interaction creates a hierarchical trace in Laminar:
📊 analyze_data (top-level span)
├── 🤖 LLM call #1 (automatic)
├── 🔧 query_database (manual tool span)
├── 🤖 LLM call #2 (automatic)
├── 🔧 create_visualization (manual tool span)
└── 🤖 LLM call #3 (automatic)
This captures:
- Which tools were called and in what sequence
- Tool execution results and timing
- All LLM requests/responses throughout the conversation
- Performance metrics and any errors
Here’s a screenshot of the traced interactions in Laminar:
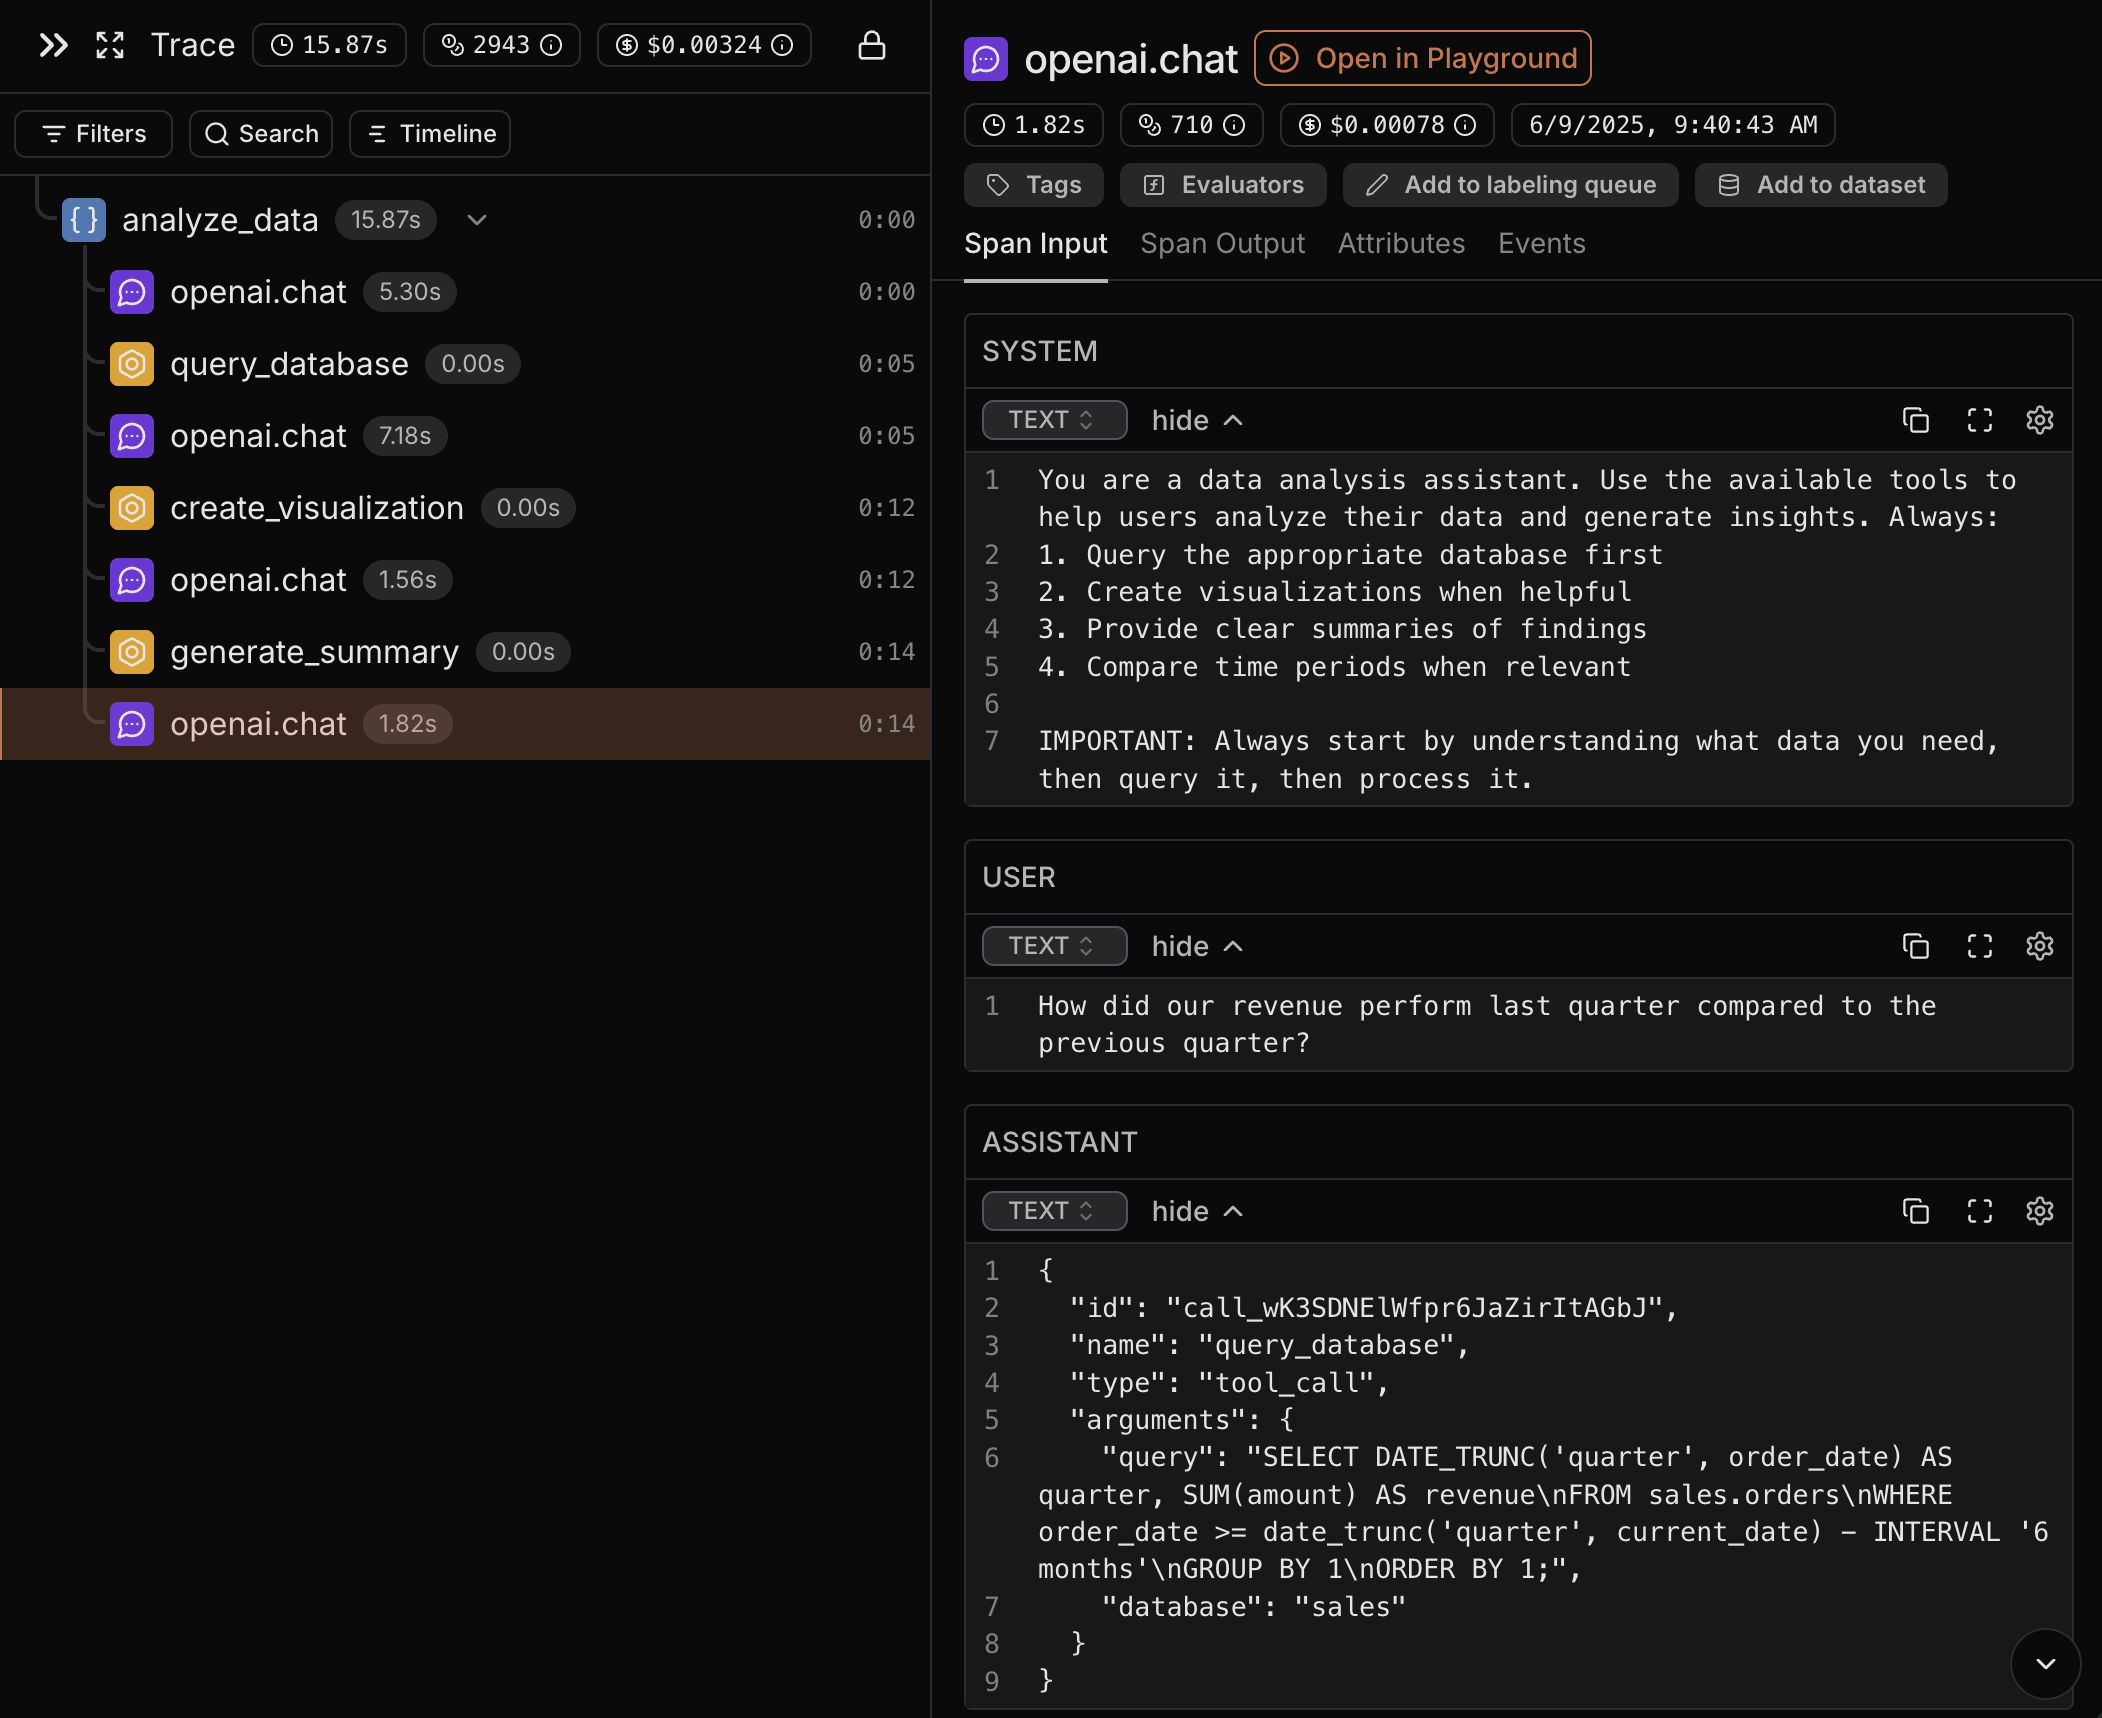
Traced interactions in Laminar
Step 2: Capturing User Feedback
Now let’s add user feedback collection using Laminar’s tagging system. The key is to save the trace ID during execution and tag the trace later when you receive user feedback.
production_agent_with_feedback.py
import os
import json
from openai import OpenAI
from lmnr import Laminar, LaminarClient, observe
from dotenv import load_dotenv
load_dotenv()
# Initialize Laminar for automatic tracing
Laminar.initialize(api_key=os.environ["LMNR_PROJECT_API_KEY"])
laminar_client = LaminarClient()
client = OpenAI()
@observe("analyze_data")
def analyze_data(user_query: str):
# ... rest of the code ...
# get trace id from the current span
trace_id = Laminar.get_trace_id()
# add trace id to the response
return {"trace_id": trace_id, "response": # ... original response ...}
# Example of how to add tag with feedback to the trace
def add_negative_feedback(trace_id: str):
"""Tag the trace with user feedback using the trace ID"""
# Tag the entire trace with user feedback
# This applies the tag to the top-level span of the trace
laminar_client.tags.tag(trace_id, "unhelpful")
Key Points About Tagging
- Get Trace ID in span context: Call
Laminar.get_trace_id()
inside the @observe
d function or inside manually created span to capture the trace ID
- Store for Later: Save the trace ID along with your session data so you can tag it when feedback arrives
- Tag the Trace: Use
laminar_client.tags.tag(trace_id, tag_name)
to apply tags to the entire trace. For example, you can have a user feedback feature in your app that tags the trace with unhelpful
when the user provides feedback.
- Top-Level Span: When you tag a trace, it applies the tag to the top-level span, making it easy to filter in SQL queries
This approach allows you to collect feedback asynchronously - users can provide feedback minutes or hours after the interaction, and you can still associate it with the correct trace.
Step 3: Analyzing Problematic Cases with SQL Editor
After collecting feedback in production, use Laminar’s SQL Editor to identify patterns in unsuccessful interactions.
SQL editor is available from any page in Laminar and can be accessed by clicking the “console” button in the top right corner in the navigation bar.
-- Get the LLM spans from traces tagged as "unhelpful"
SELECT
input,
output
FROM spans
WHERE span_type = 'LLM'
AND trace_id IN (SELECT trace_id FROM spans WHERE tag = 'unhelpful')
ORDER BY start_time DESC;
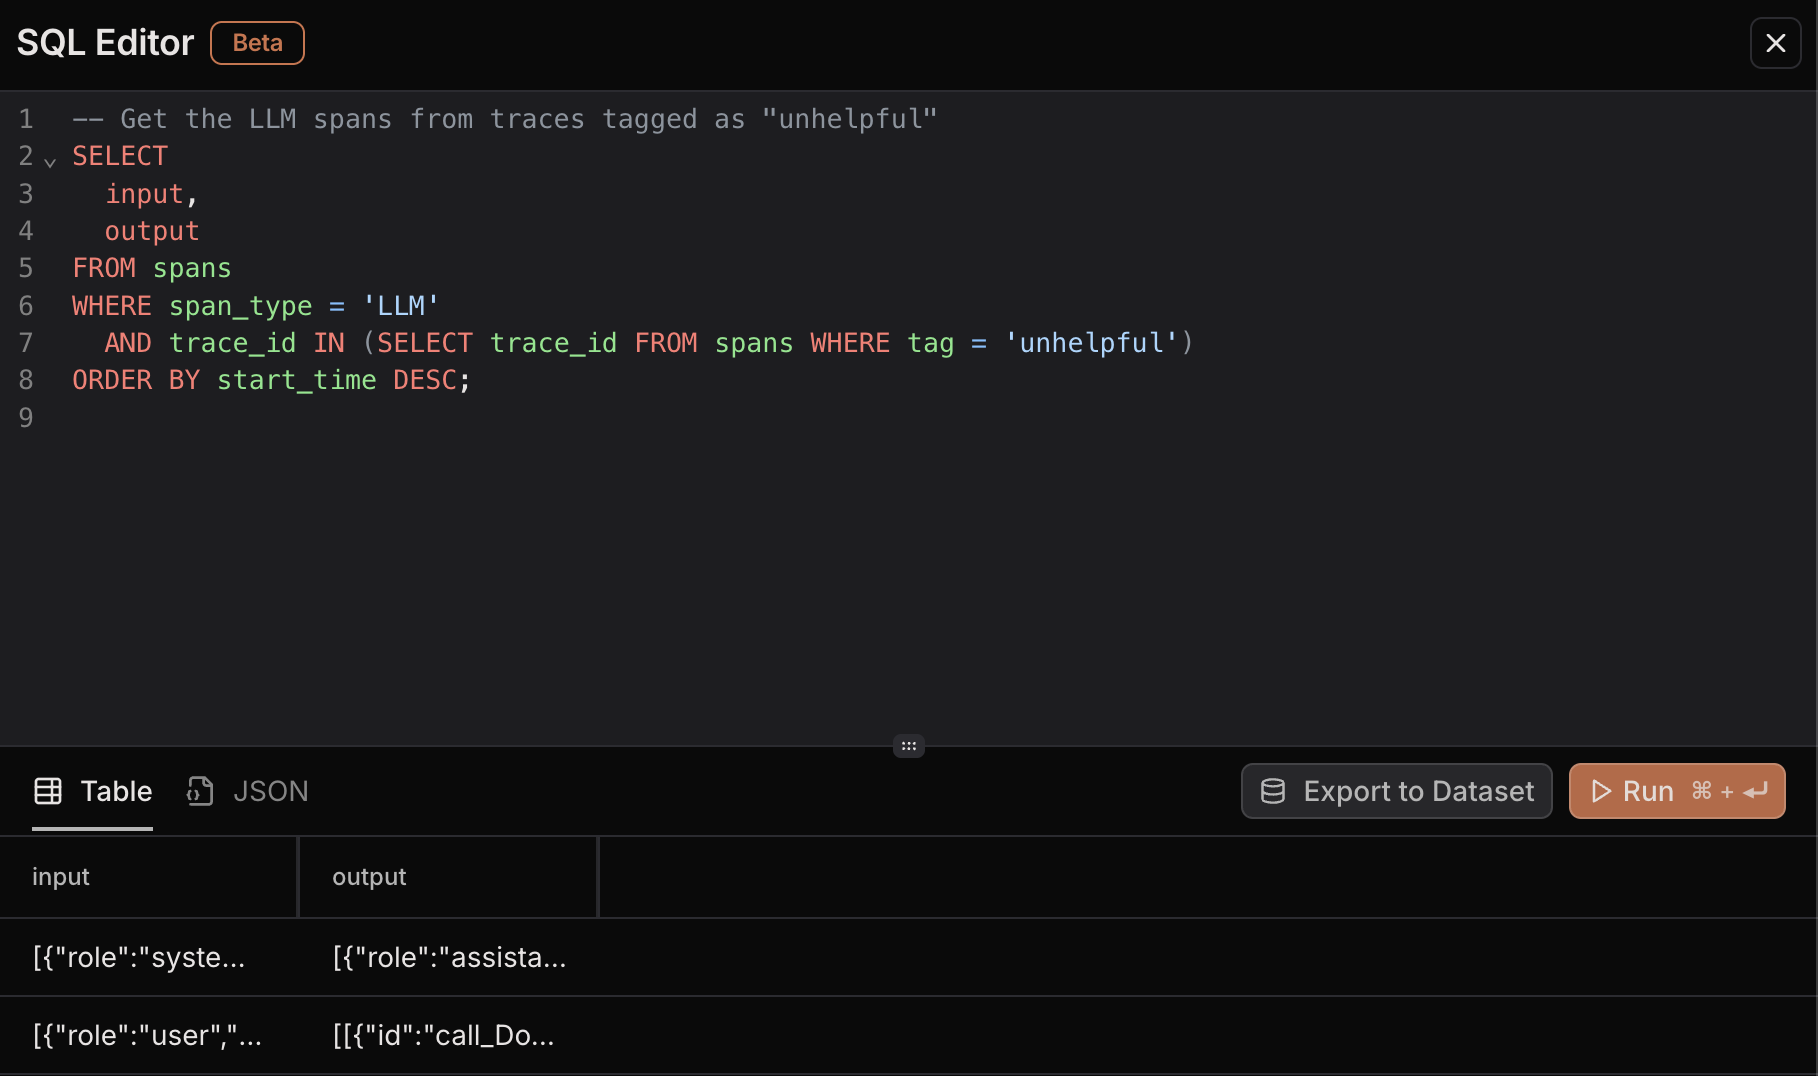
Example of using Laminar's SQL Editor to query traced interactions
Then click on the export to dataset
button to export the results to a dataset.
Drag output
field to the target
column and input
field to the data
column.
Then click on the create dataset
button to create new dataset.
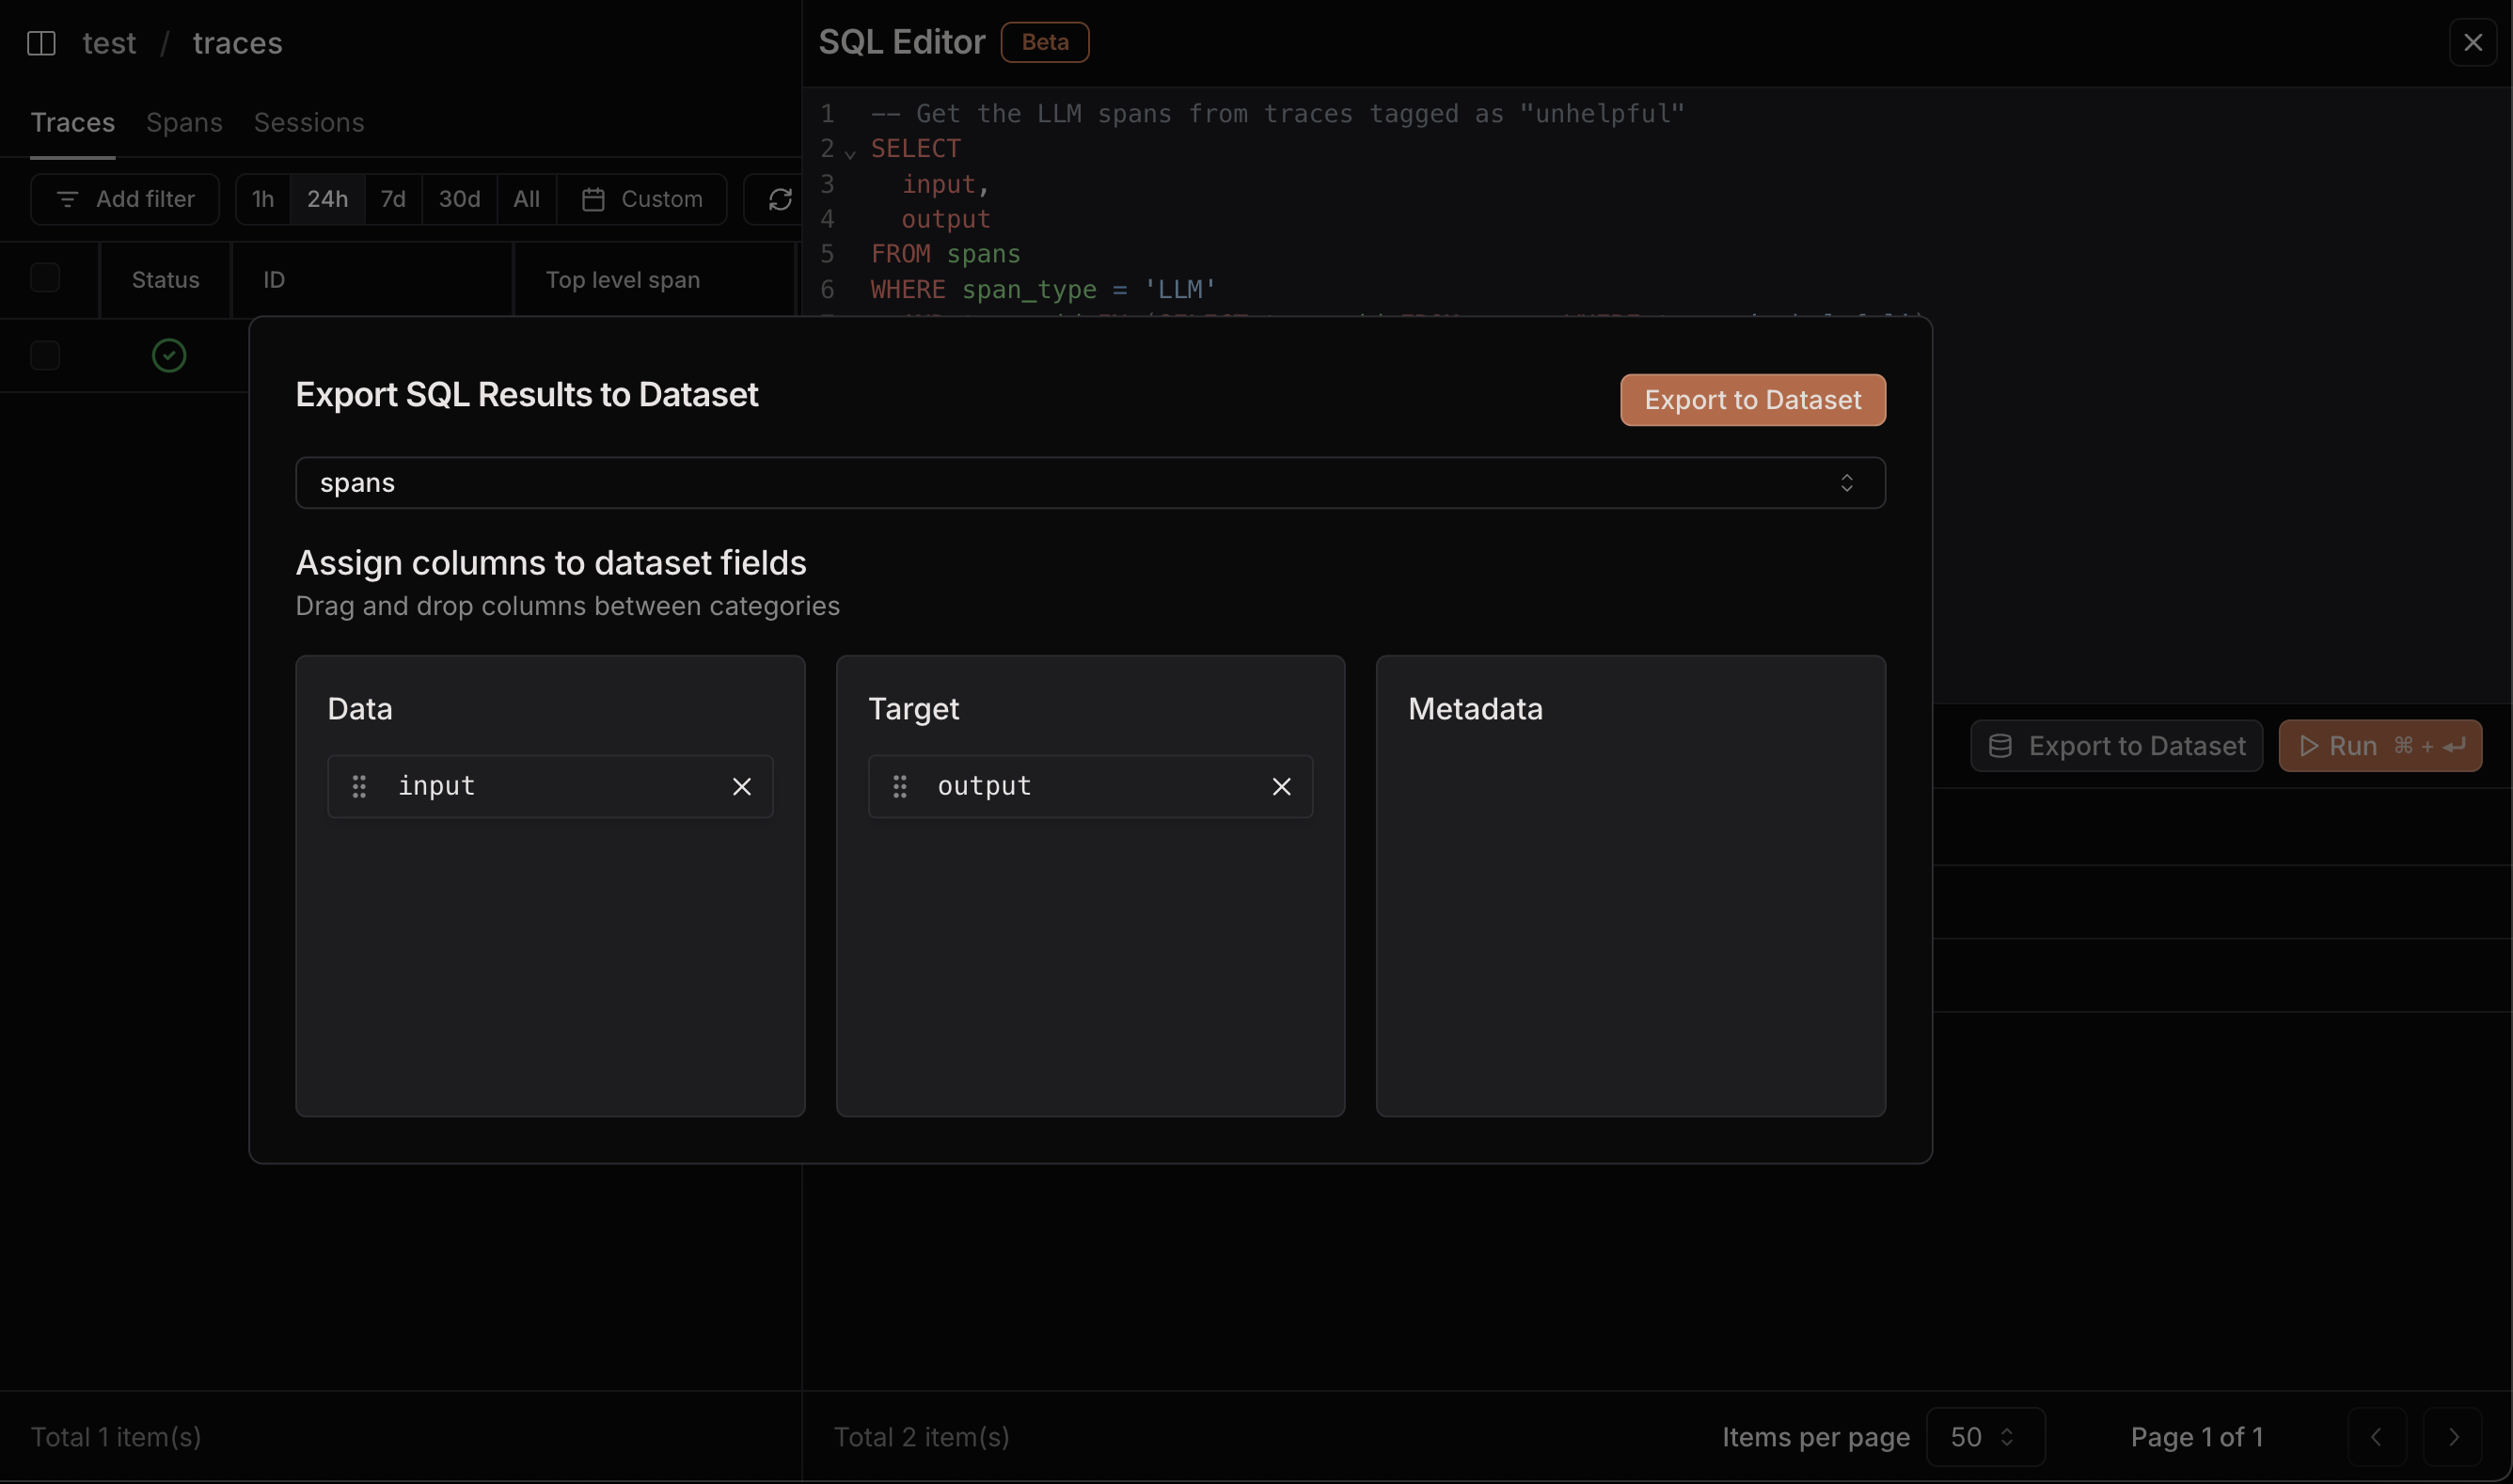
Exporting query results to dataset for labeling
Push dataset to labeling queue
Now navigate to the newly created dataset from the previous step. In the dataset view:
- Export to labeling queue: Click the “Add all to labeling queue” button
- Choose labeling queue: Either create a new labeling queue or select an existing one
This process moves your problematic cases from the dataset into a structured labeling workflow where human annotators can provide the correct expected outputs for tool calls.
Step 4: Label data and create evaluation dataset
Laminar provides a convenient split-screen labeling interface that makes it easy to quickly label your data and build evaluation datasets.
In this step, we will use labeling queue from the previous step to label the data and create an evaluation dataset.
The Labeling Interface
When you open your labeling queue, you’ll see an efficient split-screen interface:
Left Panel - Payload View: Shows the full JSON structure of the current item, including the user’s original query in the data
field and the agent’s problematic response in the target
field.
Right Panel - Target Editor: This is where you provide the correct expected output. You can:
- Edit the existing response to fix tool selection issues
- Write completely new target responses with correct tool calls
- Use proper JSON formatting with syntax highlighting
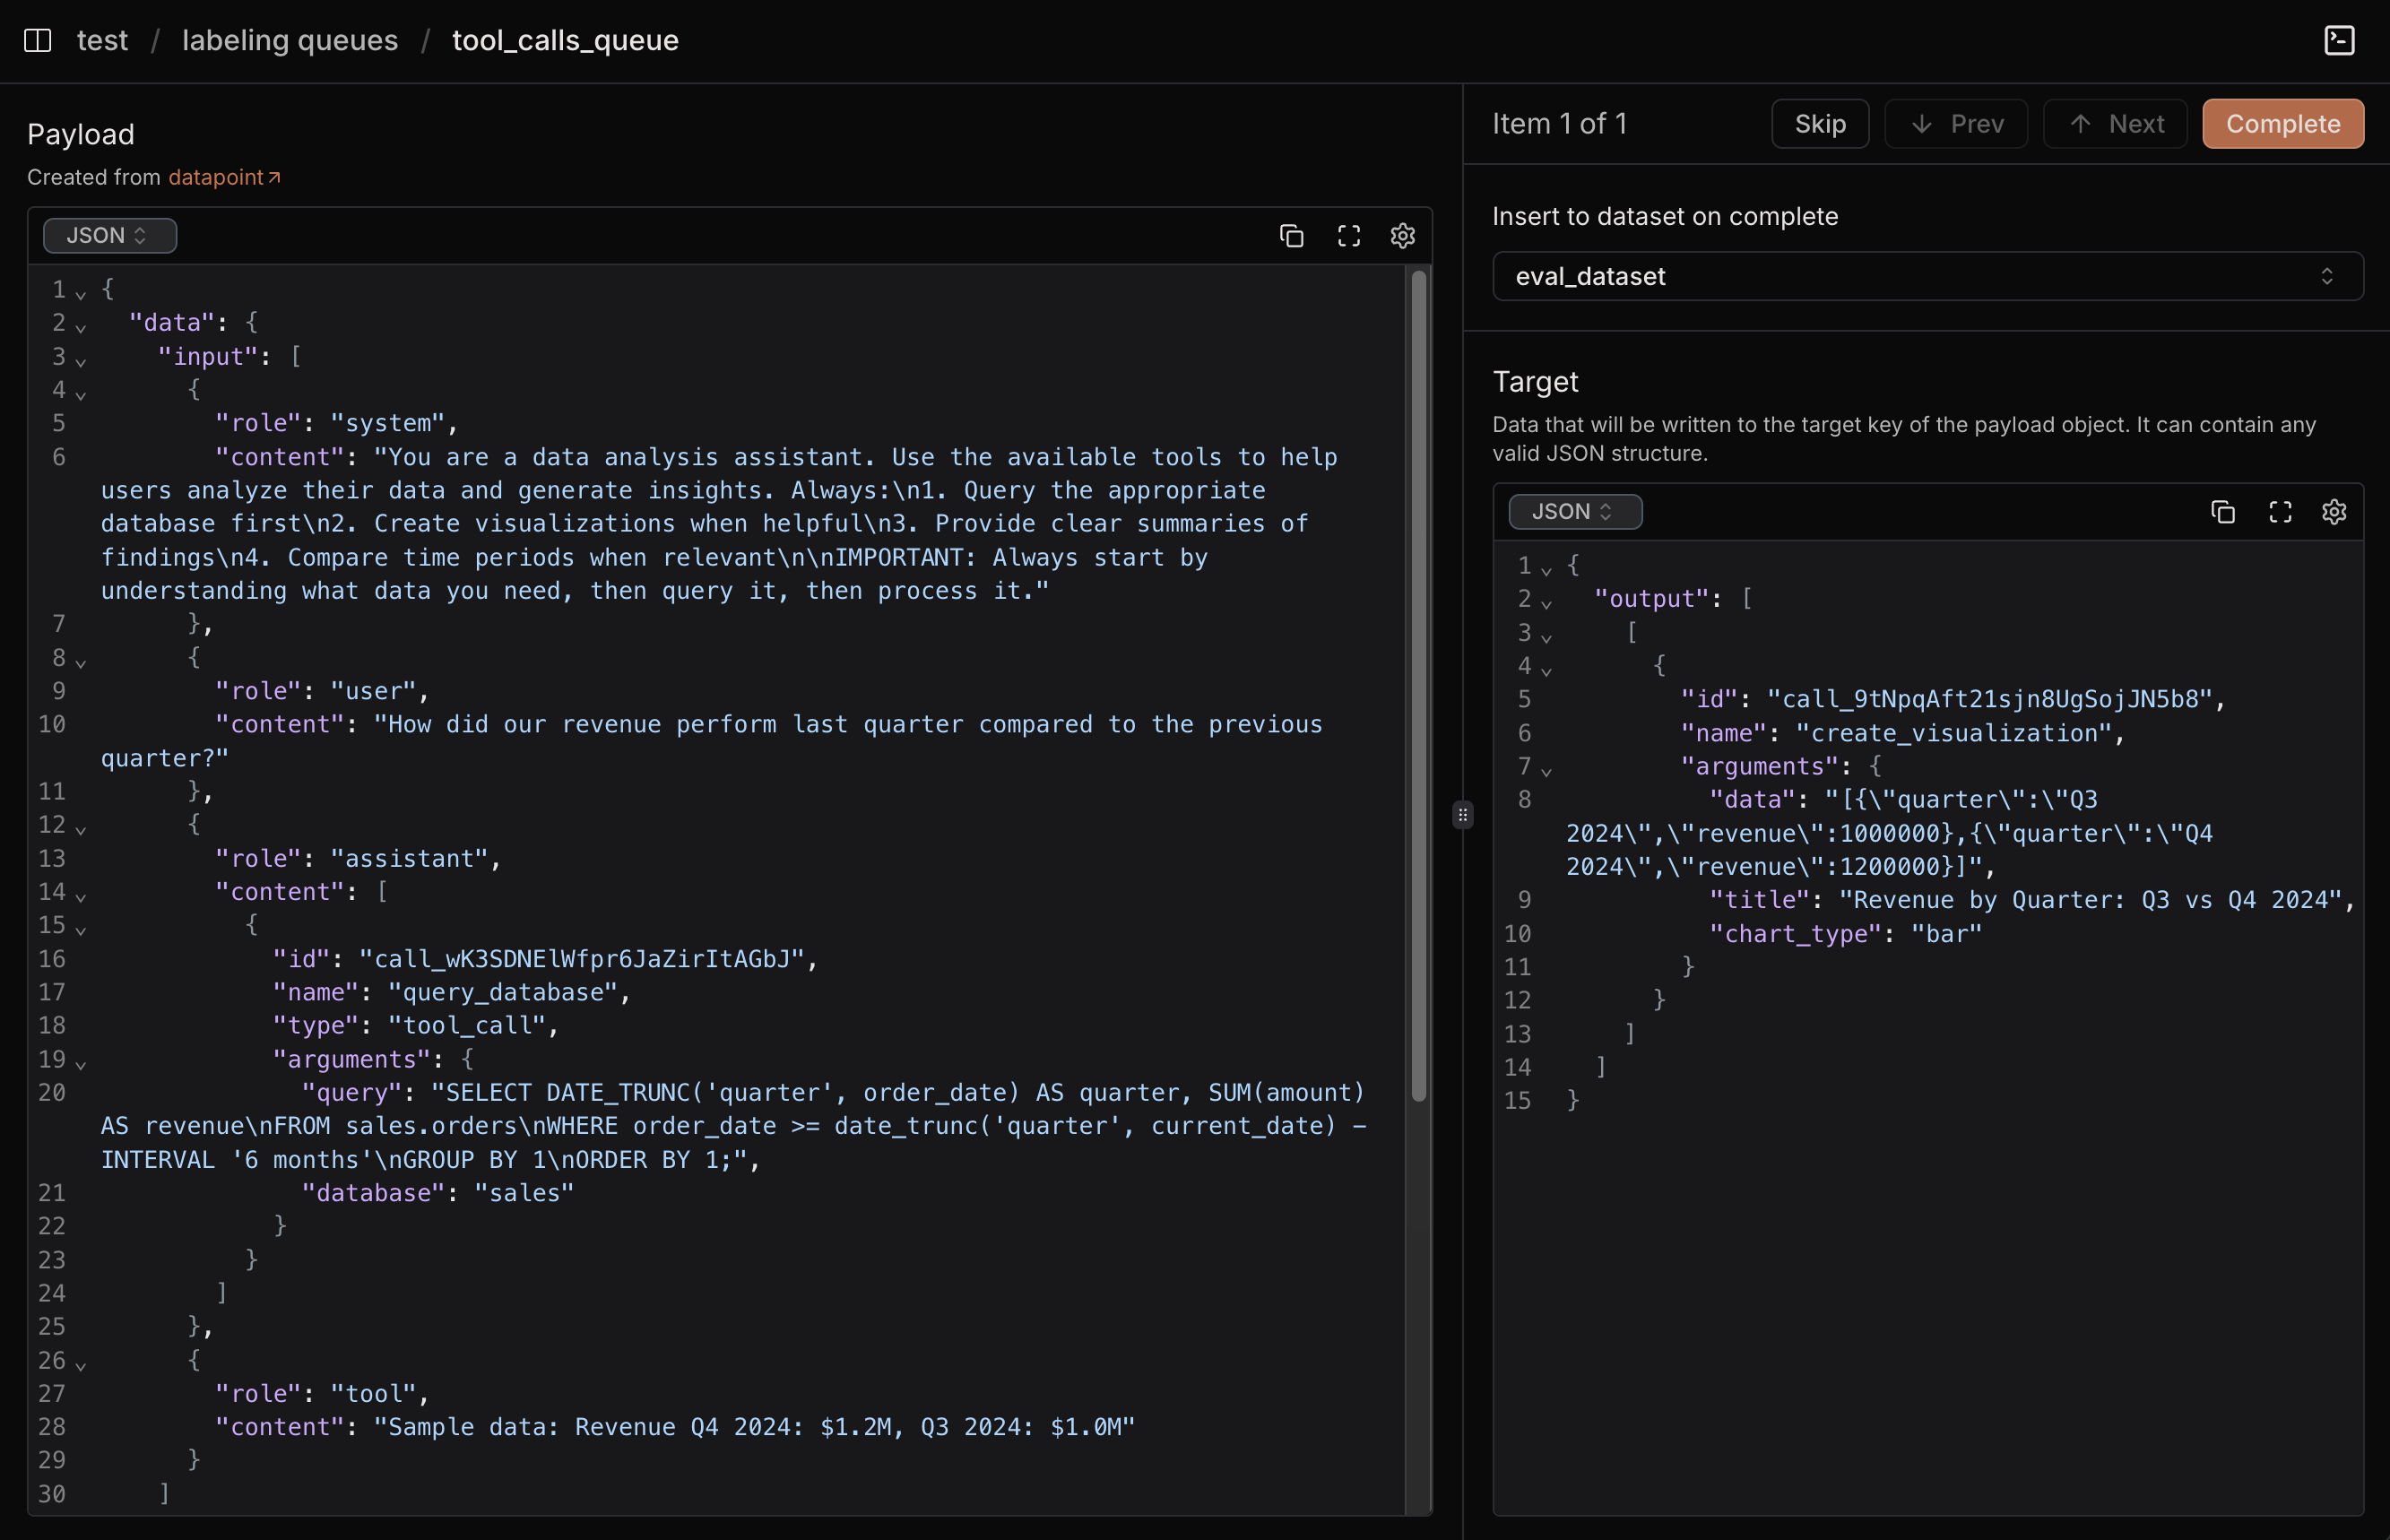
Laminar's labeling interface for tool call evaluation
Labeling Workflow
For each problematic tool call case:
- Review the original query in the payload view (left panel)
- Analyze what went wrong with the agent’s response
- Write the correct expected output in the target editor (right panel)
- Select your target dataset from the dropdown. You can create a new dataset or select an existing one.
- Click “Complete” to save and move to the next item
Each completed
datapoint will be automatically added to the target dataset.
This dataset will be used for evaluation in the next step.
As you type in the target editor, the left panel updates in real-time, showing exactly what will be saved to your evaluation dataset. This immediate feedback helps ensure accuracy in your labeling.
Once your dataset is created, we can reference it in evaluations using LaminarDataset("eval_dataset")
.
With our labeled dataset ready, we can now run systematic evaluations.
The key insight is that our dataset contains the original conversation messages in the OpenAI format, which allows us to test different system prompts while keeping the user queries consistent.
Understanding the Dataset Structure
From the labeling process, each datapoint in our evaluation dataset has this structure:
{
"data": {
"input": [
{"role": "system", "content": "You are a data analysis assistant..."},
{"role": "user", "content": "Show me sales performance compared to last quarter"},
{"role": "assistant", "content": "..."},
{"role": "tool", "tool_call_id": "call_9tNpqAft21sjn8UgSojJN5b8"}
]
},
"target": {
"output": [
{
"id": "call_9tNpqAft21sjn8UgSojJN5b8",
"name": "create_visualization",
"arguments": {
"data": "[{\"quarter\":\"Q3 2024\",\"revenue\":1000000},{\"quarter\":\"Q4 2024\",\"revenue\":1200000}]",
"title": "Revenue by Quarter: Q3 vs Q4 2024",
"chart_type": "bar"
}
}
]
}
}
This structure allows us to:
- Test new system prompts by replacing the system message
- Keep user queries consistent for fair comparison
- Compare against expected tool calls from human labeling
Create evaluation directory structure
├── src/
├── evals/
│ ├── eval_tool_selection.py
Main evaluation file
evals/eval_tool_selection.py
from lmnr import evaluate, LaminarDataset
from openai import OpenAI
import json
import os
from dotenv import load_dotenv
load_dotenv()
client = OpenAI()
# Same tools as production - consistency is key
tools = [
{
"type": "function",
"function": {
"name": "query_database",
"description": "Execute SQL queries to retrieve data from the database",
"parameters": {
"type": "object",
"properties": {
"query": {"type": "string", "description": "SQL query to execute"},
"database": {"type": "string", "enum": ["analytics", "sales", "users"]}
},
"required": ["query", "database"]
}
}
},
{
"type": "function",
"function": {
"name": "create_visualization",
"description": "Create charts and graphs from data",
"parameters": {
"type": "object",
"properties": {
"data": {"type": "string", "description": "Data to visualize"},
"chart_type": {"type": "string", "enum": ["line", "bar", "pie", "scatter"]},
"title": {"type": "string", "description": "Chart title"}
},
"required": ["data", "chart_type"]
}
}
},
{
"type": "function",
"function": {
"name": "compare_periods",
"description": "Compare metrics across different time periods",
"parameters": {
"type": "object",
"properties": {
"metric": {"type": "string", "description": "Metric to compare"},
"period1": {"type": "string", "description": "First time period"},
"period2": {"type": "string", "description": "Second time period"}
},
"required": ["metric", "period1", "period2"]
}
}
}
]
def data_analysis_agent(data):
"""Executor function that tests new system prompts"""
# Get the original messages from the dataset
original_messages = data["input"]
# Create new messages with improved system prompt
# This is where you test prompt improvements!
messages = [
{
"role": "system",
"content": """You are a data analysis assistant. Use the available tools to help users analyze their data and generate insights. Always:
1. Query the appropriate database first
2. Create visualizations when helpful
3. Provide clear summaries of findings
4. Compare time periods when relevant
IMPORTANT: Always start by understanding what data you need, then query it, then process it."""
}
]
# Add all non-system messages from the original conversation
for msg in original_messages:
if msg["role"] != "system":
messages.append(msg)
response = client.chat.completions.create(
model="o4-mini",
messages=messages,
tools=tools,
tool_choice="auto"
)
return response
def evaluate_tool_selection(output, target):
"""Evaluator to check if correct tools were selected"""
# Extract actual tool calls from the response
actual_tool_calls = []
if hasattr(output.choices[0].message, 'tool_calls') and output.choices[0].message.tool_calls:
actual_tool_calls = [
{
"name": call.function.name,
"arguments": json.loads(call.function.arguments)
}
for call in output.choices[0].message.tool_calls
]
# Extract expected tool calls from target - fix based on actual structure
if isinstance(target, dict):
expected_tool_calls = target.get("output", [])
# Handle nested list structure: [[{tool_objects}]] -> [{tool_objects}]
if expected_tool_calls and isinstance(expected_tool_calls[0], list):
expected_tool_calls = expected_tool_calls[0]
elif isinstance(target, list):
expected_tool_calls = target
else:
# If target is something else (like a string), try to parse it
try:
if isinstance(target, str):
parsed_target = json.loads(target)
expected_tool_calls = parsed_target.get("output", []) if isinstance(parsed_target, dict) else parsed_target
else:
expected_tool_calls = []
except:
expected_tool_calls = []
# Check if we called the expected tools
expected_tool_names = [tool["name"] for tool in expected_tool_calls]
actual_tool_names = [tool["name"] for tool in actual_tool_calls]
# Simple binary check: did we call all expected tools?
for expected_tool in expected_tool_names:
if expected_tool not in actual_tool_names:
return 0
return 1
# Run the evaluation
evaluate(
data=LaminarDataset("eval_dataset"),
executor=data_analysis_agent,
evaluators={
"tool_selection": evaluate_tool_selection
},
project_api_key=os.environ["LMNR_PROJECT_API_KEY"],
group_name="improved_system_prompt_v1"
)
Testing Different System Prompts
The power of this approach is that you can easily test different system prompts:
# Version 1: Original prompt
system_prompt_v1 = """You are a data analysis assistant. Use available tools to analyze data."""
# Version 2: More detailed instructions
system_prompt_v2 = """You are a data analysis assistant. Always:
1. Query appropriate database first
2. Create visualizations when helpful
3. Provide clear summaries"""
# Version 3: Emphasize tool sequencing
system_prompt_v3 = """You are a data analysis assistant. CRITICAL: Always follow this sequence:
1. Understand what data is needed
2. Query the database to get that data
3. Process/analyze the results
4. Create visualizations if helpful
5. Summarize findings clearly"""
Simply swap the content
field in the system message to test different versions and see which performs better on your real production failure cases.
Running the evaluation
You can run this evaluation in two ways:
Using the CLI
# Set your project API key
export LMNR_PROJECT_API_KEY=<YOUR_PROJECT_API_KEY> # skip if you set LMNR_PROJECT_API_KEY in .env file
# Run single evaluation file
lmnr eval evals/eval_tool_selection.py
# Or run all evaluations in the evals directory
lmnr eval
Running as a standalone script
python evals/eval_tool_selection.py
Viewing Results and Iteration
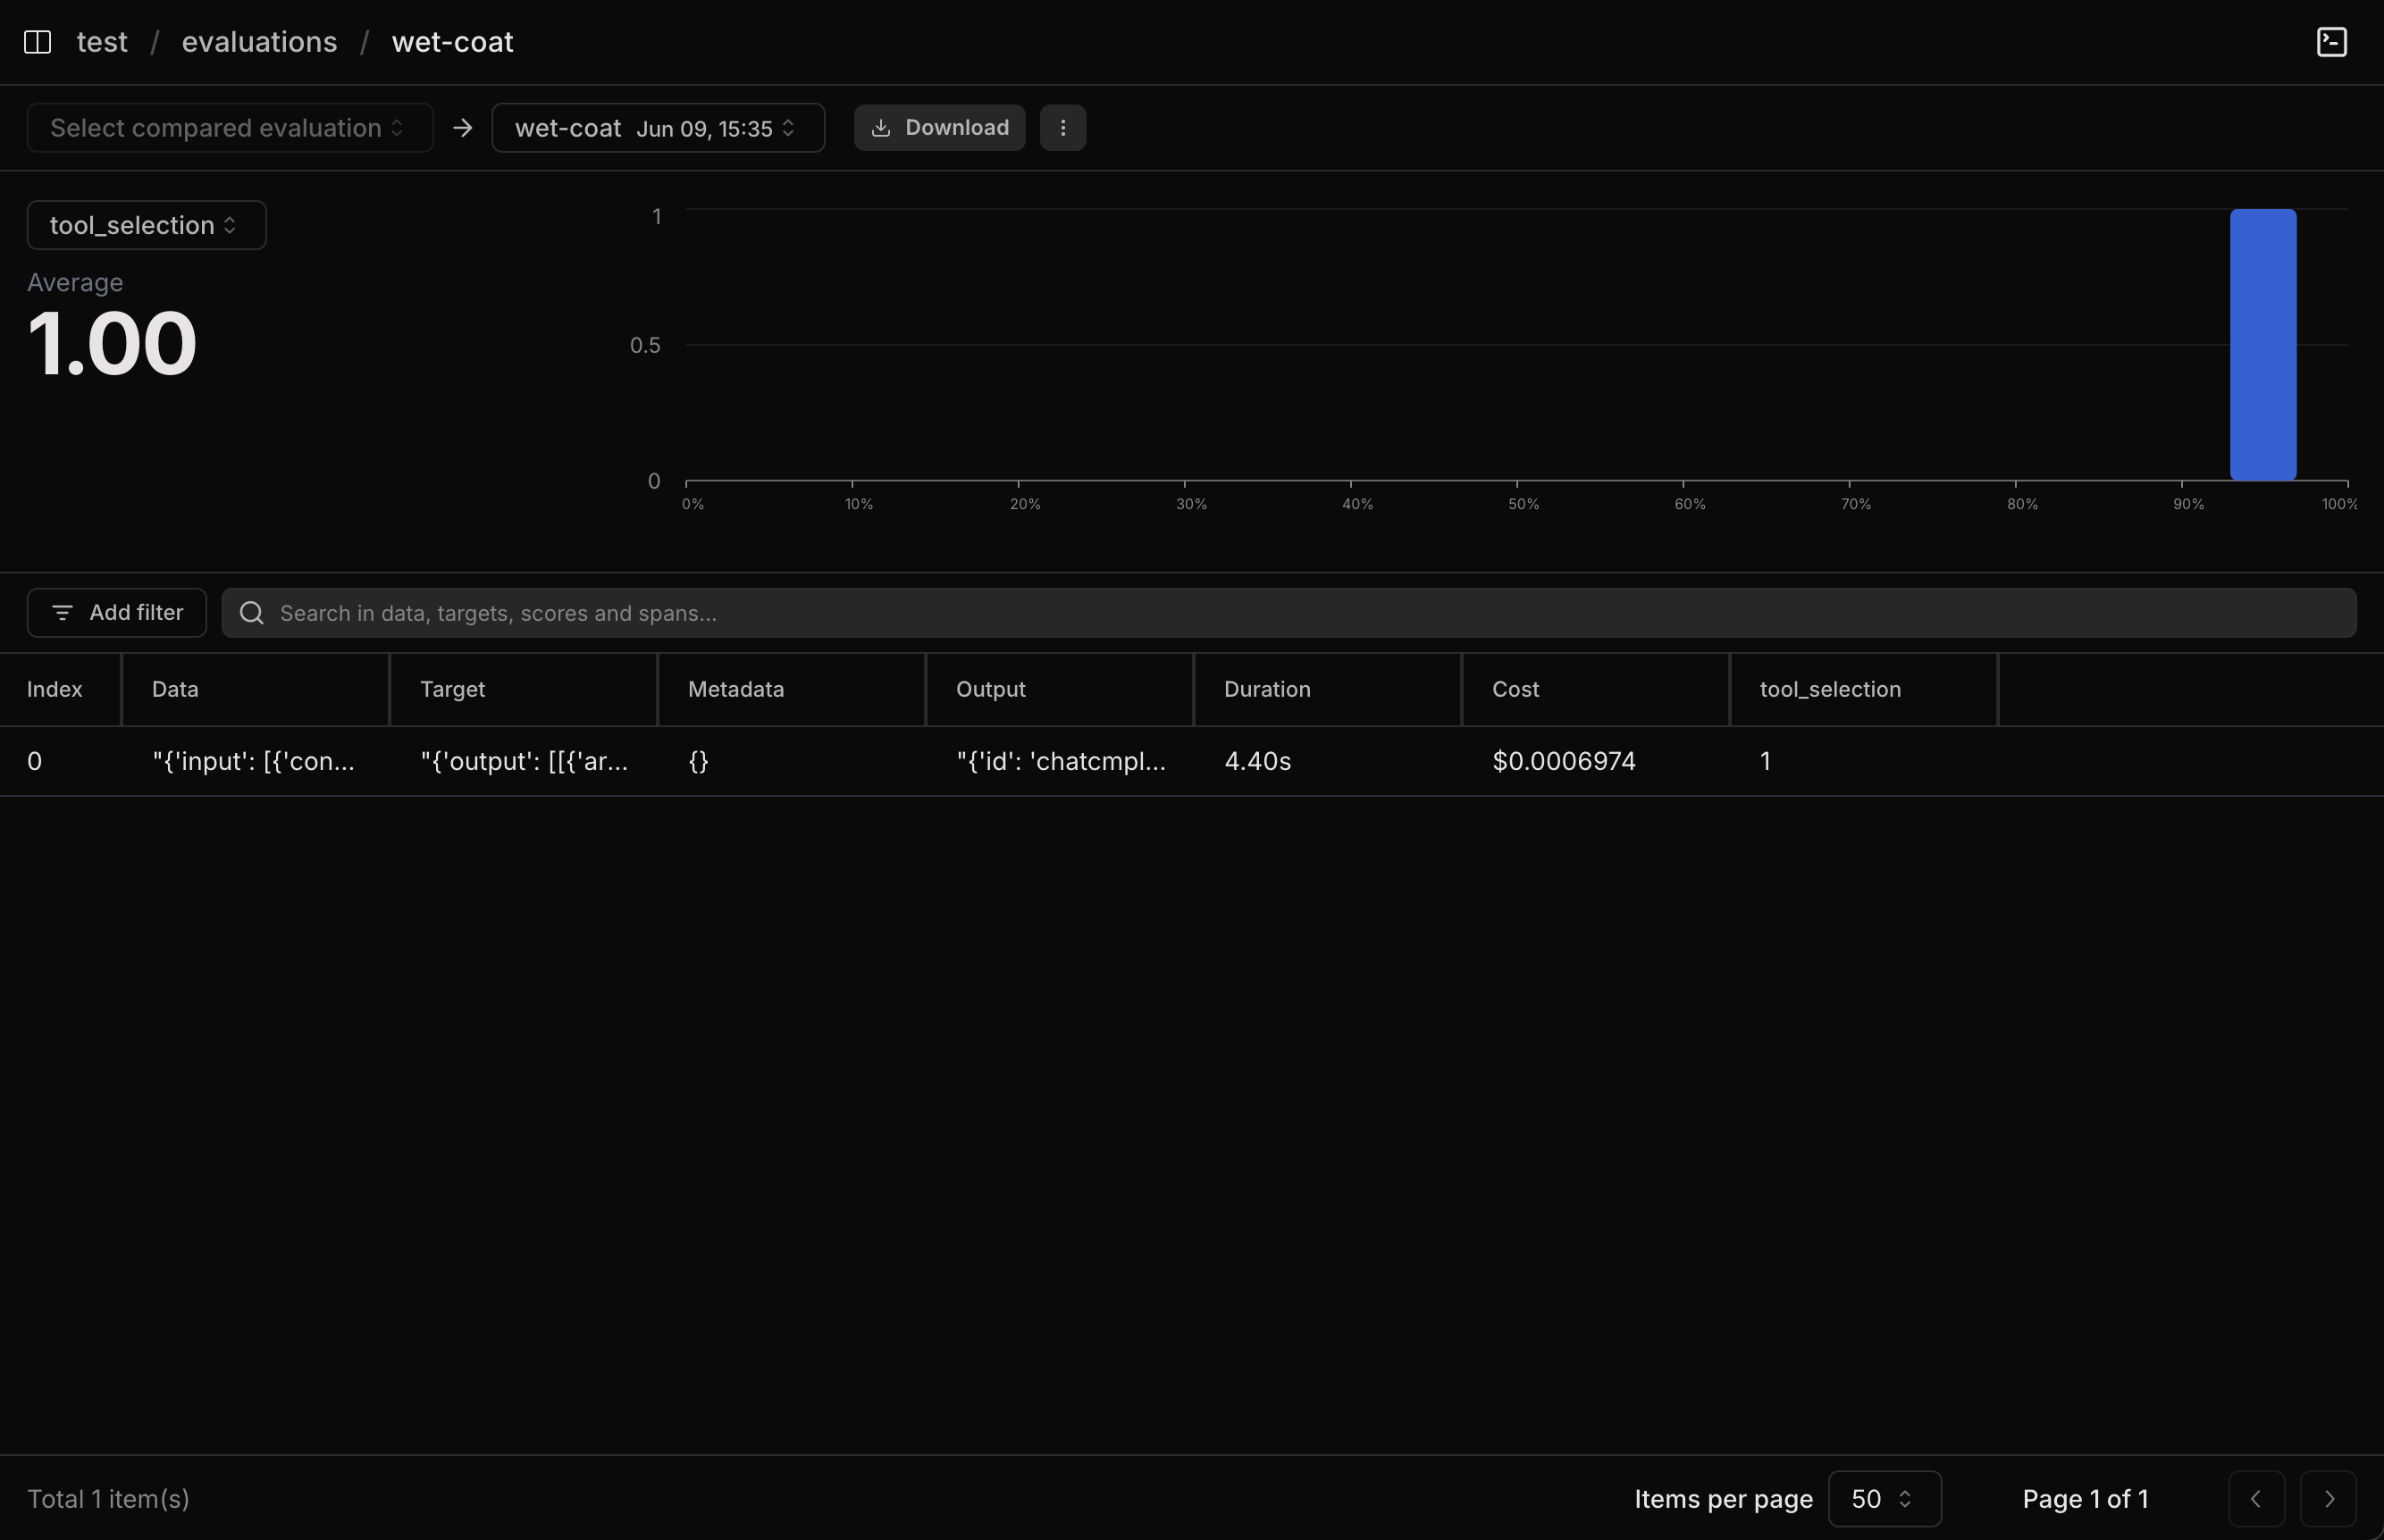
Evaluation results in Laminar
After running evaluations, the Laminar evaluation view shows:
- Overall Scores: How your agent performs across all metrics
- Individual Cases: Traces of each evaluation
- Performance Trends: How scores improve over iterations
Use these insights to:
- Improve Prompts: Refine system prompts based on failure patterns
- Adjust Tool Selection Logic: Update tool descriptions or parameters
- Add New Tools: Identify missing capabilities from user feedback
- Update Training Data: Create more diverse evaluation cases
This approach ensures the Data Analysis Assistant continuously improves based on real user interactions and systematic evaluation, leading to more reliable and useful AI agents.
Learn More
To dive deeper into the concepts covered in this guide:
- Tracing Documentation: Learn more about automatic instrumentation, manual span creation, and advanced tracing patterns
- Evaluations Documentation: Explore advanced evaluation patterns, custom evaluators, and evaluation best practices